
Image
|
Figure Caption
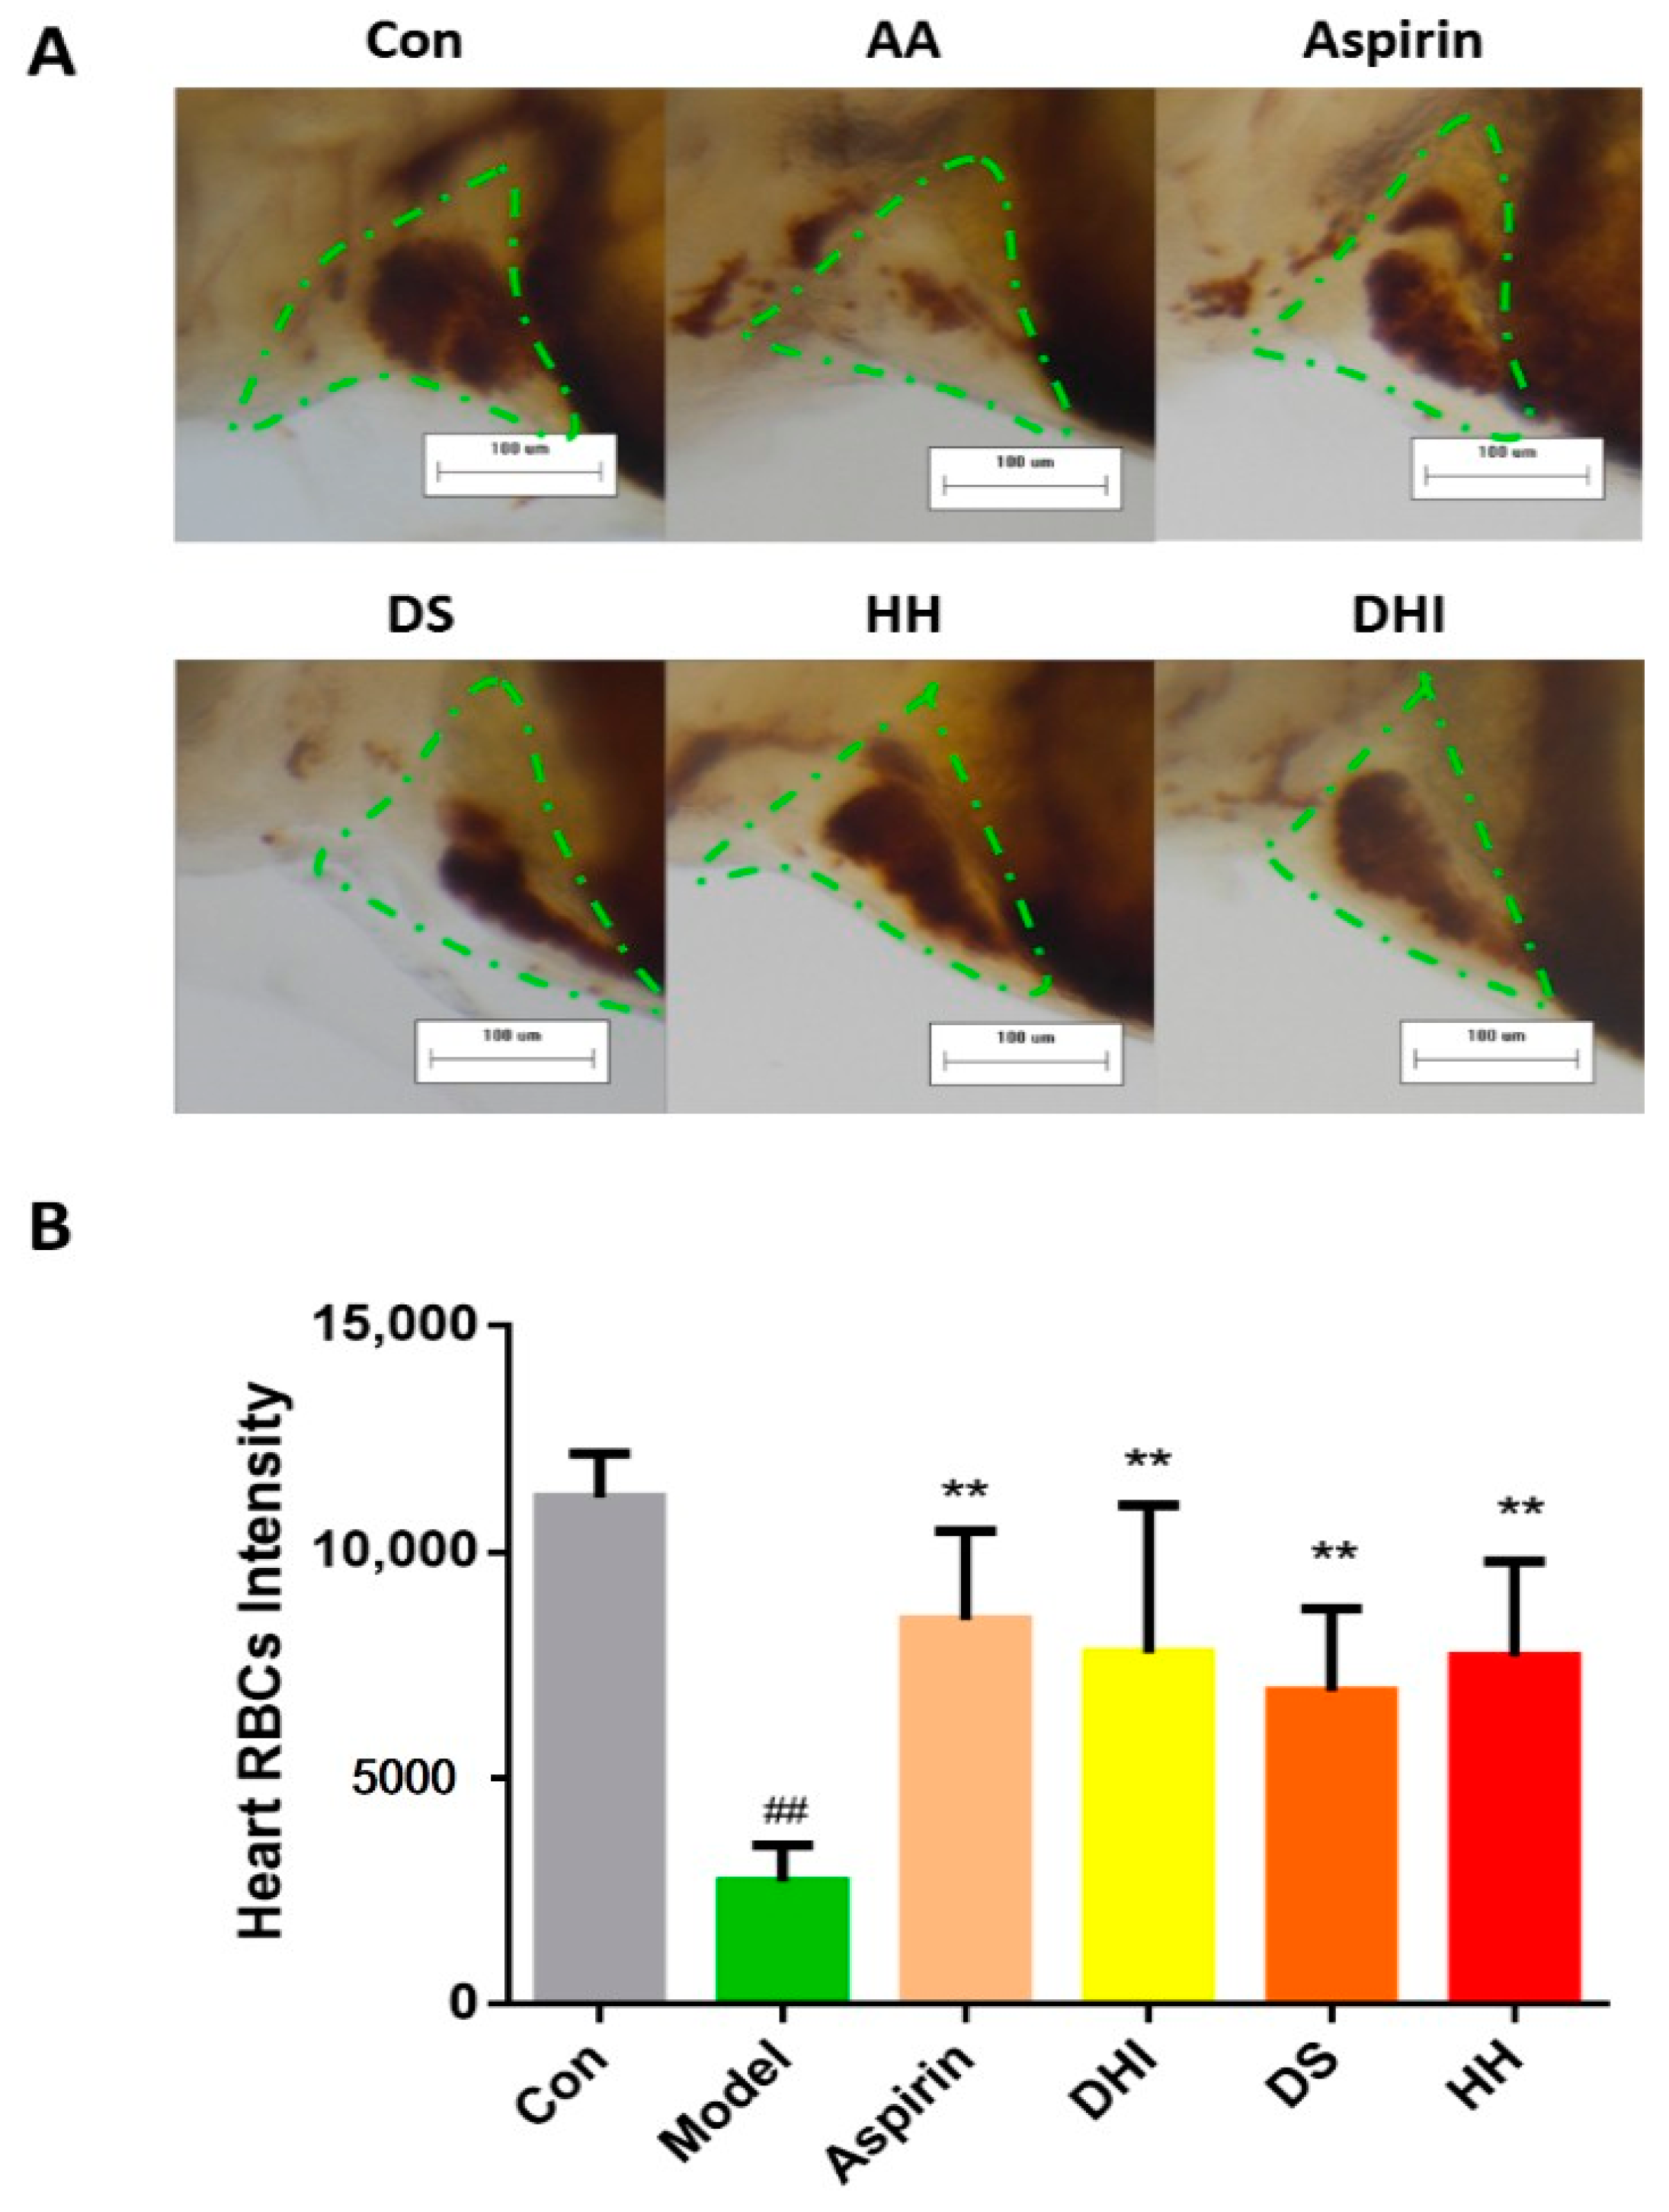
Fig. 3
Heart red blood cells (green dashed line) stained with o-dianisidine (A) and the heart red blood cell intensity in the zebrafish of the control group, model group (AA 40 μM), positive drug group (aspirin 22.5 μg/mL), danshen (DS) group (100 μL/mL), honghua (HH) group (100 μL/mL), and danhong group (100 μL/mL), at a 100× magnification; (B) The error bars represent the standard deviation based on ten repeated samples. All data was represented by the mean ± SD, ## p < 0.01, ** p < 0.01, n = 10.
Figure Data
Acknowledgments
This image is the copyrighted work of the attributed author or publisher, and
ZFIN has permission only to display this image to its users.
Additional permissions should be obtained from the applicable author or publisher of the image.
Full text @ Molecules