
Fig. S3
- ID
- ZDB-IMAGE-170927-17
- Publication
- Madigan et al., 2017 - A Macrophage Response to Mycobacterium leprae Phenolic Glycolipid Initiates Nerve Damage in Leprosy
- All Figures
- Figures for Madigan et al., 2017
|
Fig. S3
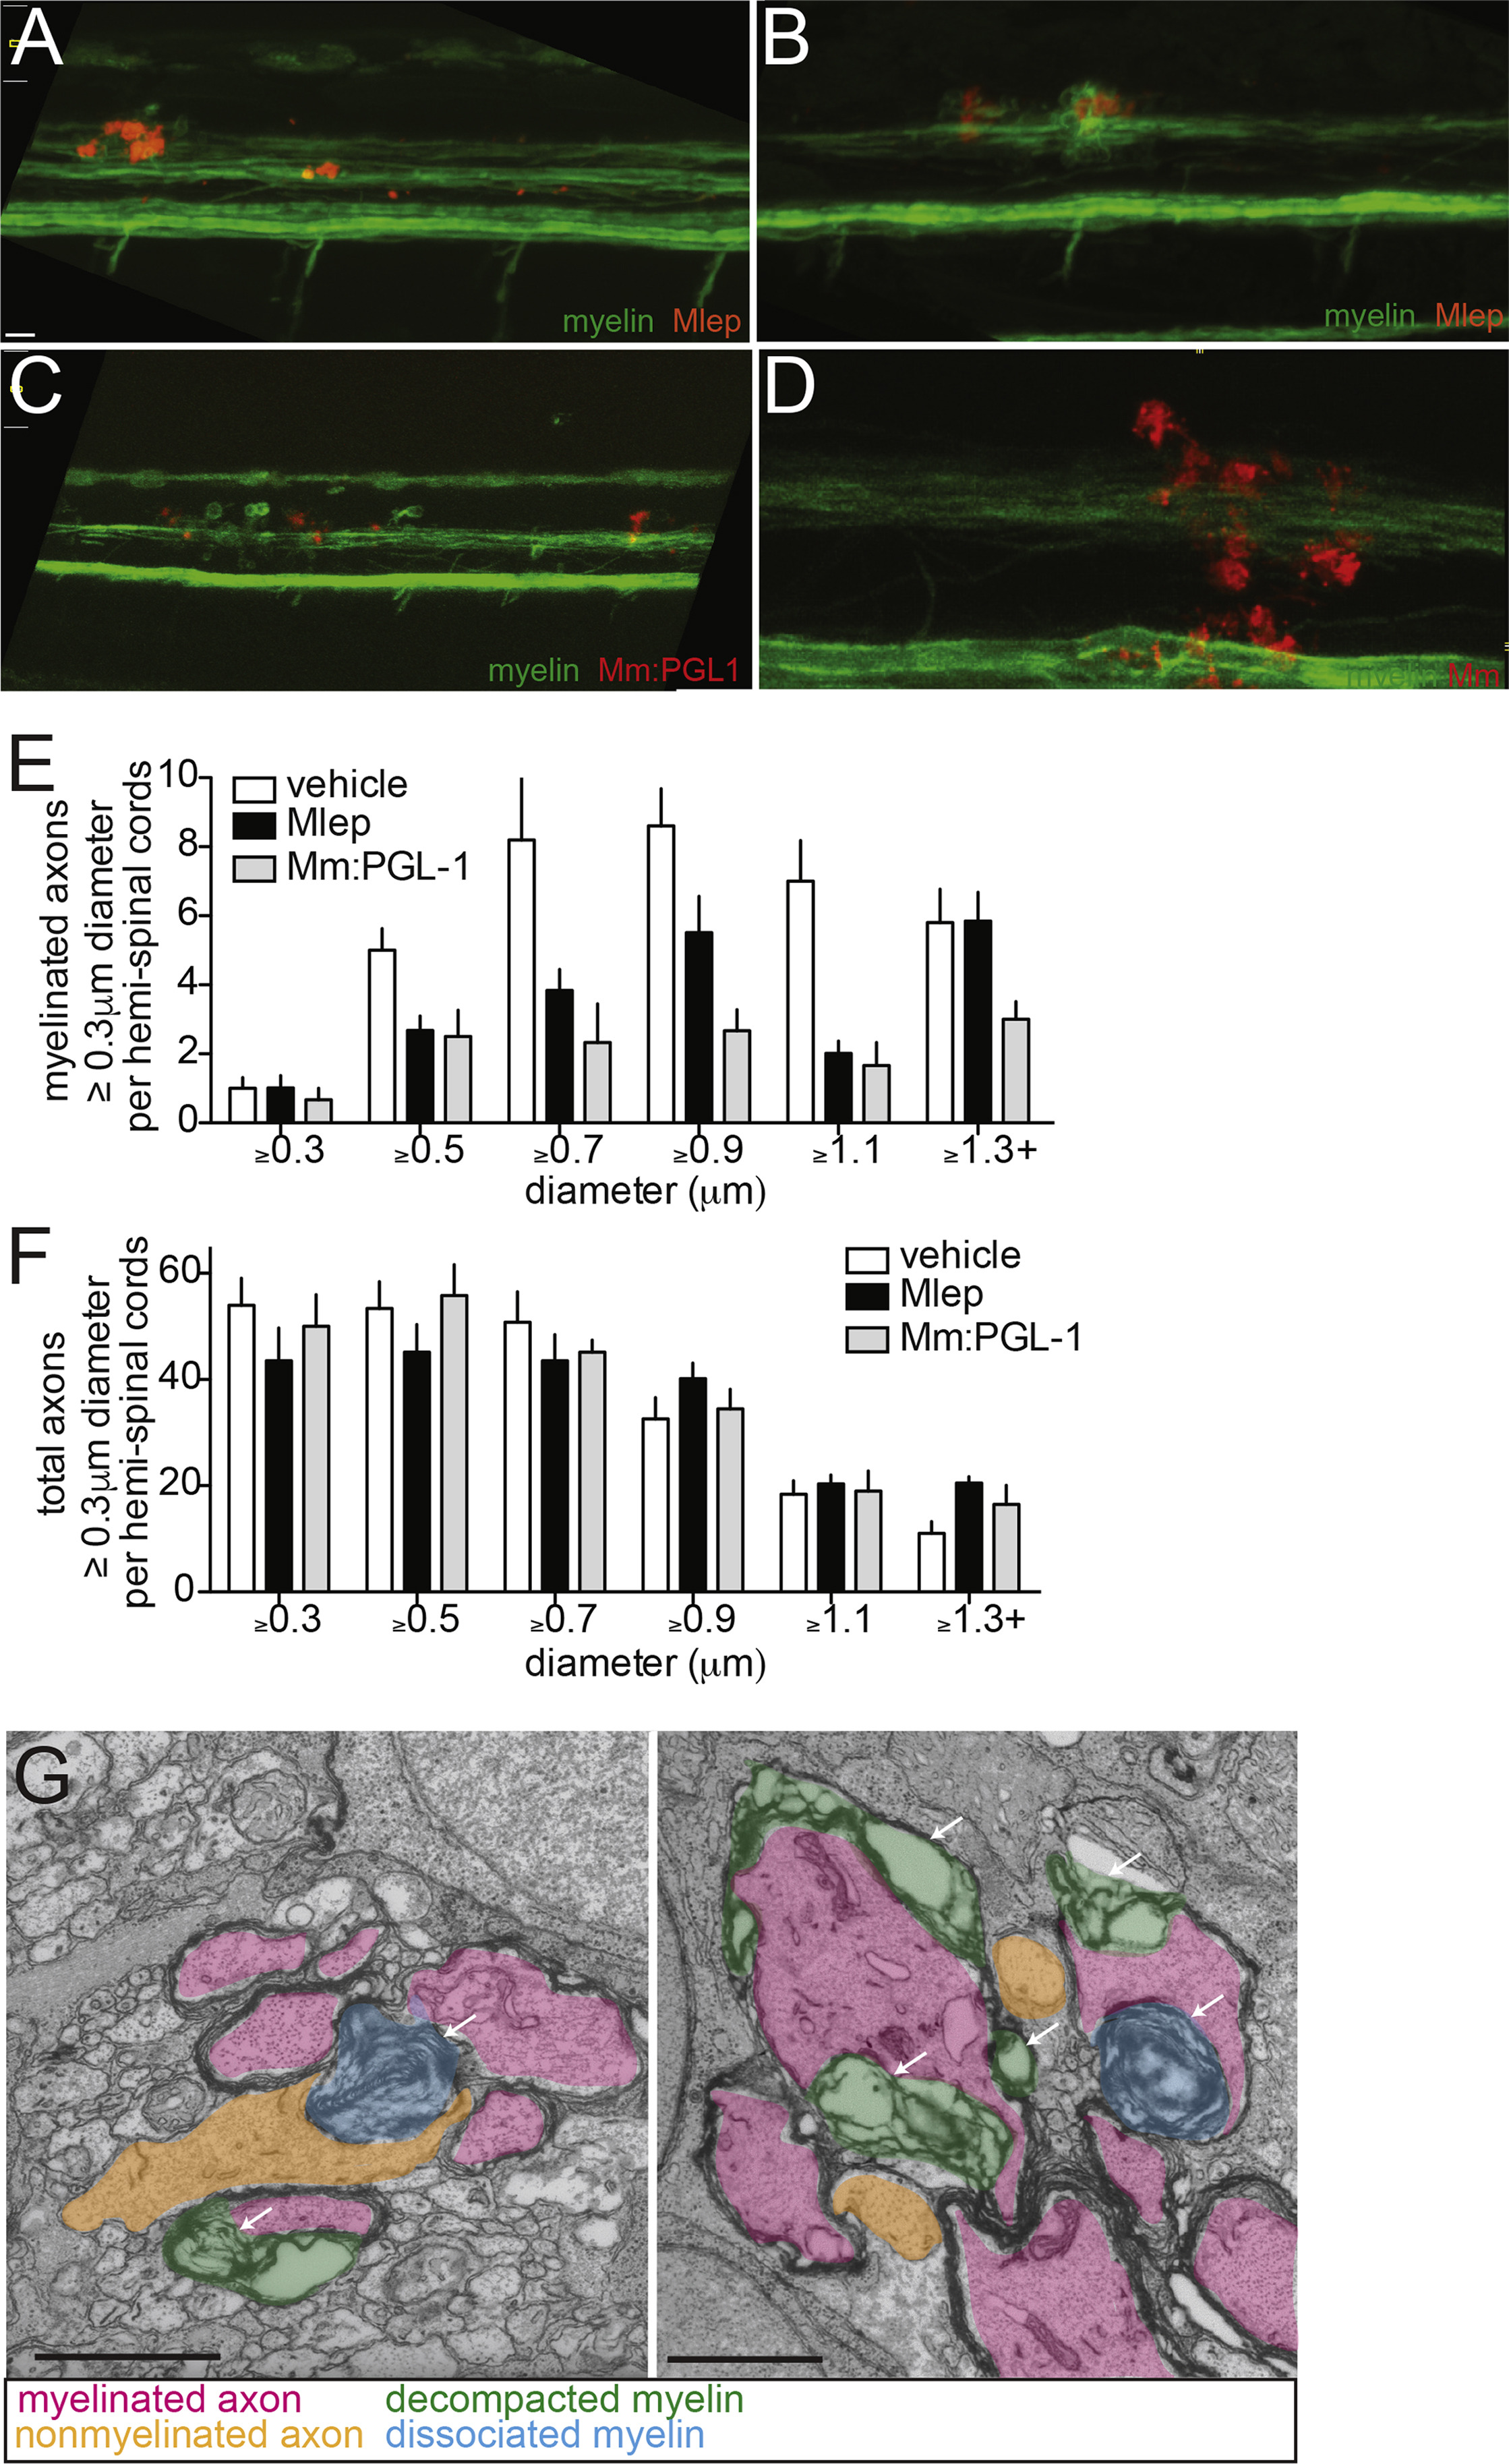
Nerve Damage in Infected Larvae, Related to Figures 3C and 4.
Lower magnification views of mbp:eGFP-CAAX larvae at 2 dpi (4 dpf) or 4 dpi (6 dpf) with M. leprae and M. marinum:PGL-1, showing the apparently intact myelin sheath outside of the lesion (M. marinum shown for comparison). 10 μm bar.
(A) 2 dpi, M. leprae.
(B) 4 dpi, M. leprae.
(C) 2 dpi, M. marinum:PGL-1.
(D) 2 dpi, WT M. marinum.
(E) Mean (±SEM) number of myelinated axons randomly selected (see the STAR Methods) in the hemi-spinal cords of 5 dpf larvae 2 days post-injection (dpi) with PBS control vehicle (white), M. leprae (black) or M. marinum:PGL-1 (gray). 3 larvae per group.
(F) Mean (±SEM) number of total axons, quantified as in (E).
(G) Two additional examples of myelin decompaction and dissociation in the spinal cords of M. leprae-infected fish from Figure 4B. Highlights indicate myelinated axons (pink), nonmyelinated axons (orange), decompacted myelin (green highlight and arrows), and myelin dissociated from axons (blue highlight and arrows). 10 μm bars.