Image
Figure Caption
Fig. 3
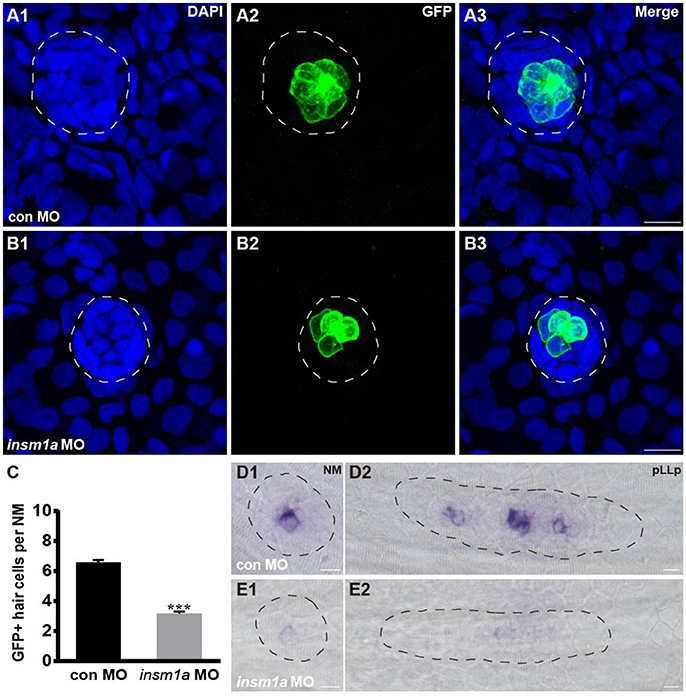
Insm1a regulates hair cell formation in the neuromasts. (A,B) Representative images of the GFP-expressing hair cells in 72 hpf Brn3c:GFP control embryos (A) and insm1a morphants (B). (C) Bar graph of the quantification of the average GFP-positive hair cell numbers per neuromast (NM) for each group. Data are expressed as means ± s.e.m. ***p < 0.001. (D,E) Lateral views of neuromasts and primordia stained by WISH with an atoh1a probe at 30 hpf. The primordium and neuromast are outlined with dotted lines. In all figures, scale bars are 10 μm.
Figure Data
Acknowledgments
This image is the copyrighted work of the attributed author or publisher, and
ZFIN has permission only to display this image to its users.
Additional permissions should be obtained from the applicable author or publisher of the image.
Full text @ Front. Mol. Neurosci.

