
Fig. 1
- ID
- ZDB-IMAGE-170925-16
- Genes
- Publication
- Xie et al., 2017 - Lef1-dependent hypothalamic neurogenesis inhibits anxiety
- All Figures
- Figures for Xie et al., 2017
|
Fig. 1
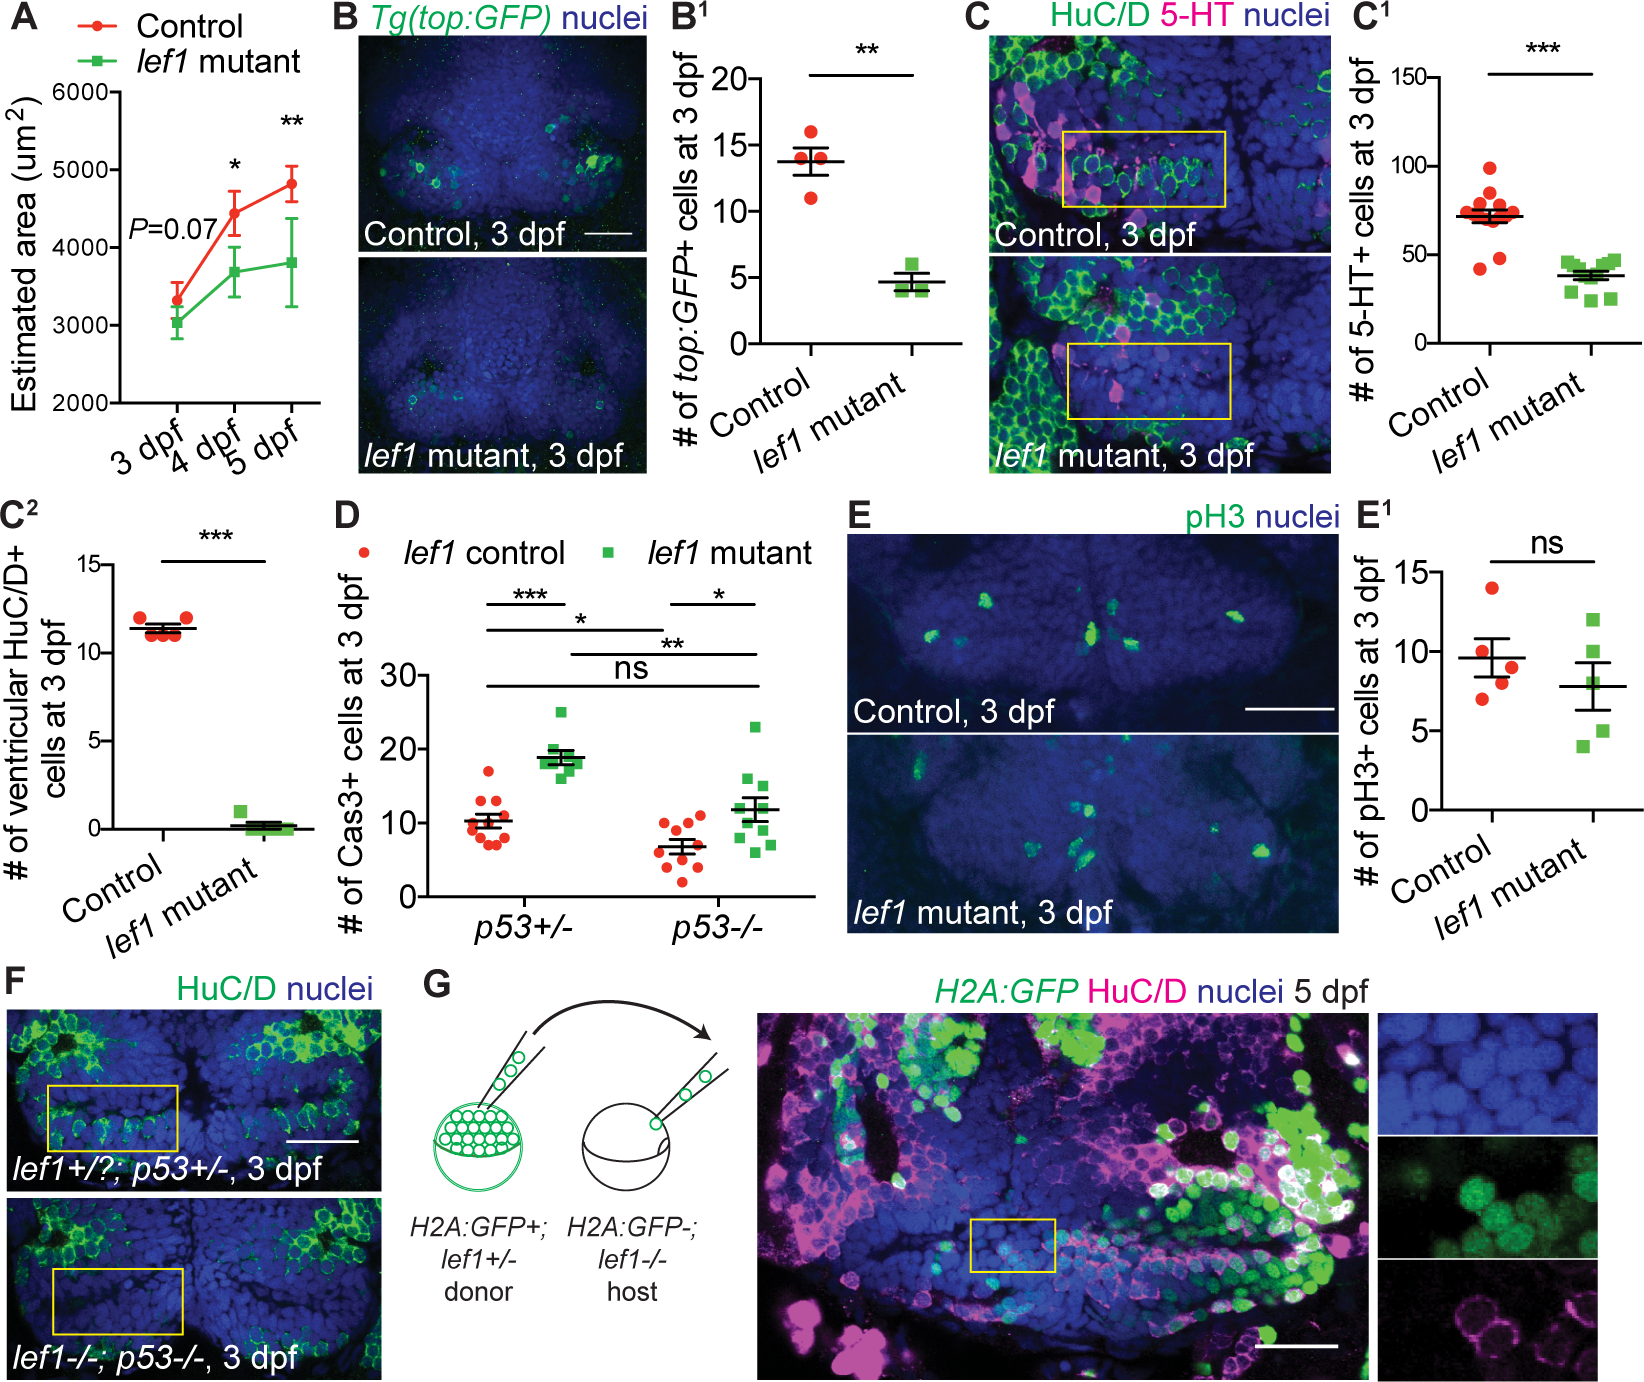
Lef1 promotes neurogenesis in the zebrafish caudal hypothalamus (Hc).
(A) Estimation of Hc size in control and lef1 mutants. See S1B Fig for method. (B-F) Immunostaining and quantification in 3 days post-fertilization (dpf) Hc. Representative immunostaining images of Wnt-responsive Tg(top:GFP)+ (B), 5-HT+ and HuC/D+ (C), and mitotic phospho-histone H3-positive (pH3+) cells (E) in control and lef1 mutants are shown on the left and quantified on the right (B1, C1, C2 and E1). Quantification of apoptotic active Caspase3+ (Cas3+) cells on the p53 mutant background is shown in (D), and representative immunostaining images of HuC/D+ cells are shown in (F). (G) Transplantation (schematic on the left) followed by HuC/D immunostaining at 5 dpf. All yellow rectangles depict the region with ventricular HuC/D+ cells normally present in wild-type (wt) fish, and magnified images in (G). All images show ventral views of whole-mounted brain with anterior on top. Data are mean ± SEM, except mean ± SD in (A). ***P < 0.001, **P < 0.01, *P < 0.05, ns. P > 0.05 by unpaired Student t tests. Scale bars: 25 μm. See S1 Table for description of confocal imaging, quantification and experimental n. Raw data can be found in S1 Data.