
|
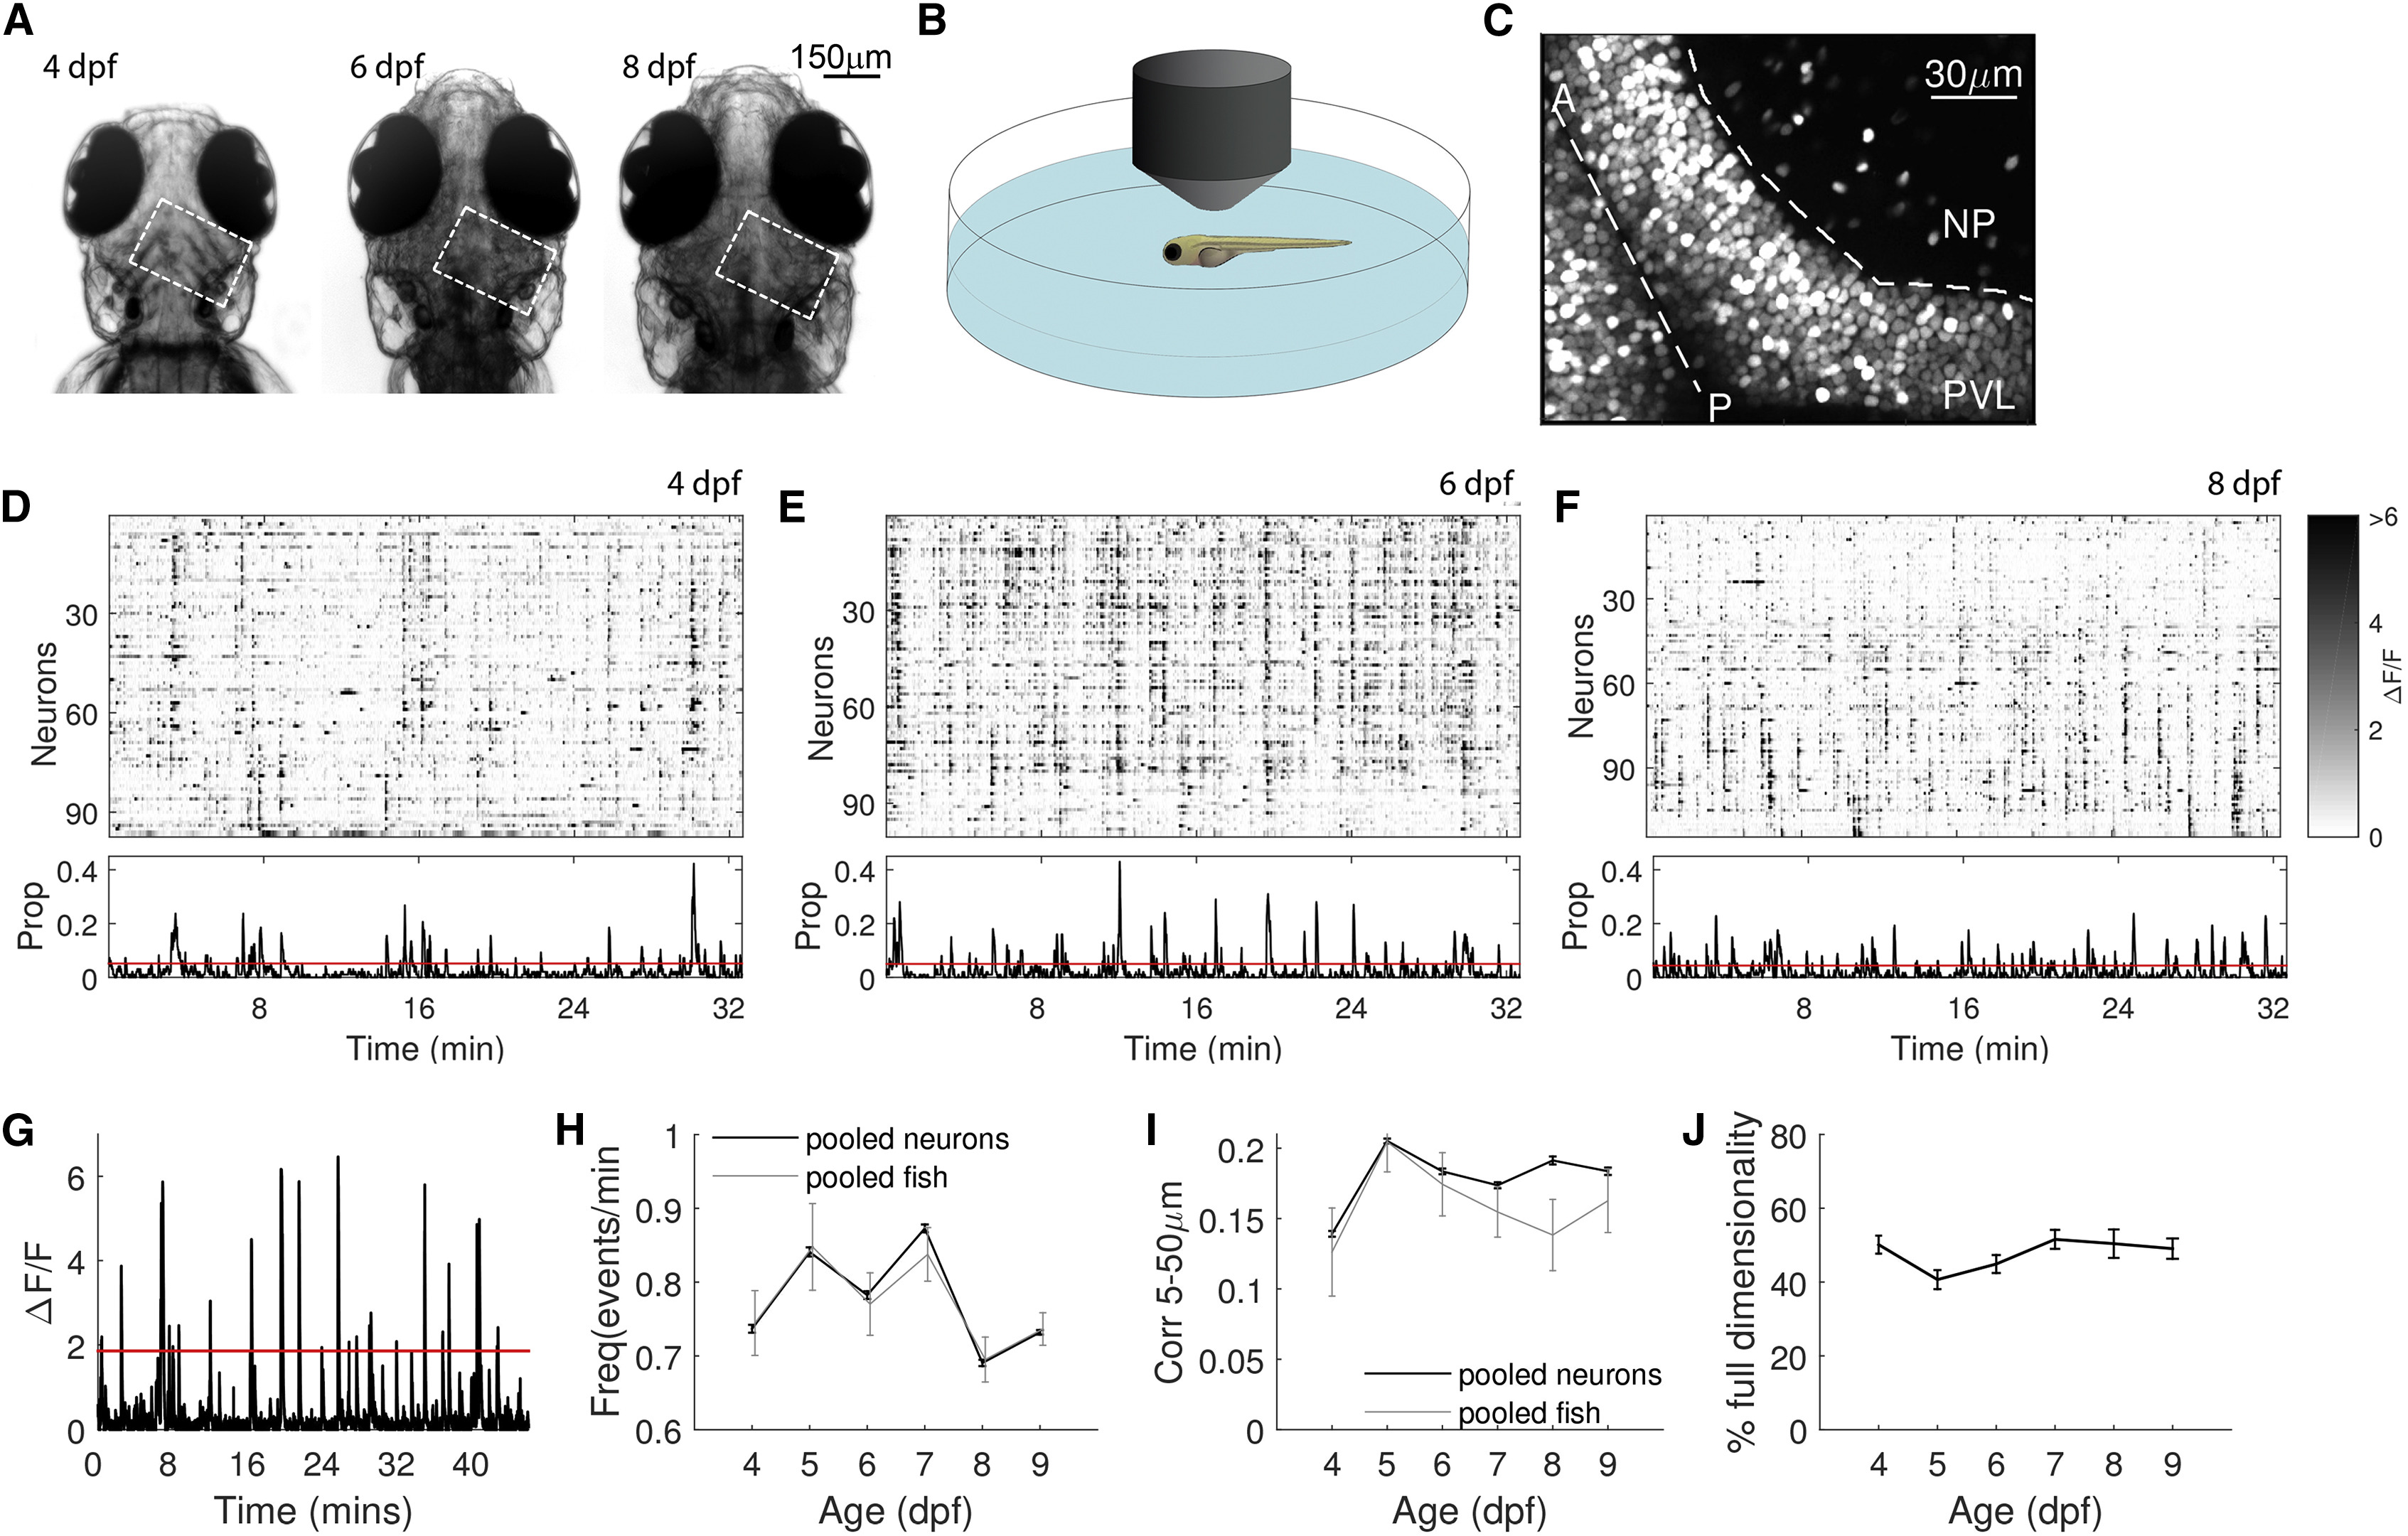
Fig. 1
Spontaneous Activity Characteristics Change over Development
(A) A developing larval zebrafish head at 4, 6, and 8 dpf. White dashed rectangle is the imaging area.
(B) Zebrafish embedded in agarose were imaged in the dark using a two-photon microscope for up to 1 hr (schematic not to scale).
(C) Fluorescence image of a 6 dpf tectum expressing H2B-GCaMP6s. PVL, NP, midline (straight dashed line), and anterior (A) and posterior (P) ends of the tectum are indicated.
(D–F) Top: raster plots of spontaneous PVL activity at 4 (D), 6 (E), and 8 dpf (F) revealing sporadic single-neuron activity as well as episodes of synchronous activity. Bottom: proportion of co-active neurons as a fraction of the population recorded for each time bin. The red line indicates the threshold derived from a shuffle control for a statistically significant proportion of co-active neurons in a frame (see STAR Methods).
(G) A ΔF/F trace of a PVL neuron from a 6 dpf fish. A neuron was considered active if ΔF/F exceeded two SDs above the mean (red line; see STAR Methods).
(H) Event frequency increases from 4 to 5–7 dpf and then decreases again at 8 and 9 dpf. Mean event frequencies over neurons (black) and fish (gray) follow a similar profile. Error bars are SEM (4 versus 5 dpf, p = 10−4; 5 versus 6 and 7 dpf, no difference; 5 versus 8 dpf, p = 10−5; 5 versus 9 dpf, p = 10−3;4 versus 8 and 9 dpf, no difference; one-way ANOVA over neurons, Bonferroni correction).
(I) Short-range pairwise correlation increases from 4 to 5 dpf. Means over neurons (black) and fish (gray) follow a similar trend (4 versus 5 dpf, p = 10−120; 5 versus 6 dpf, p = 10−14; 5 versus 7 dpf, p = 10−27; 5 versus 8 dpf, p = 10−4; 5 versus 9 dpf, p = 10−10; 4 versus 6 dpf, p = 10−47; 6 versus 7 dpf, no difference; one-way ANOVA over neurons, Bonferroni correction).
(J) Data dimensionality as the percentage of principal components required to explain 80% of the variance in activity shows a dip at 5 dpf (4 versus 5 dpf, p = 0.02; 4 dpf versus the rest, no difference; t test).
See also Figure S1.