
Fig. S2
- ID
- ZDB-IMAGE-170921-77
- Publication
- Dash et al., 2016 - sept7b is required for the differentiation of pancreatic endocrine progenitors
- All Figures
- Figures for Dash et al., 2016
|
Fig. S2
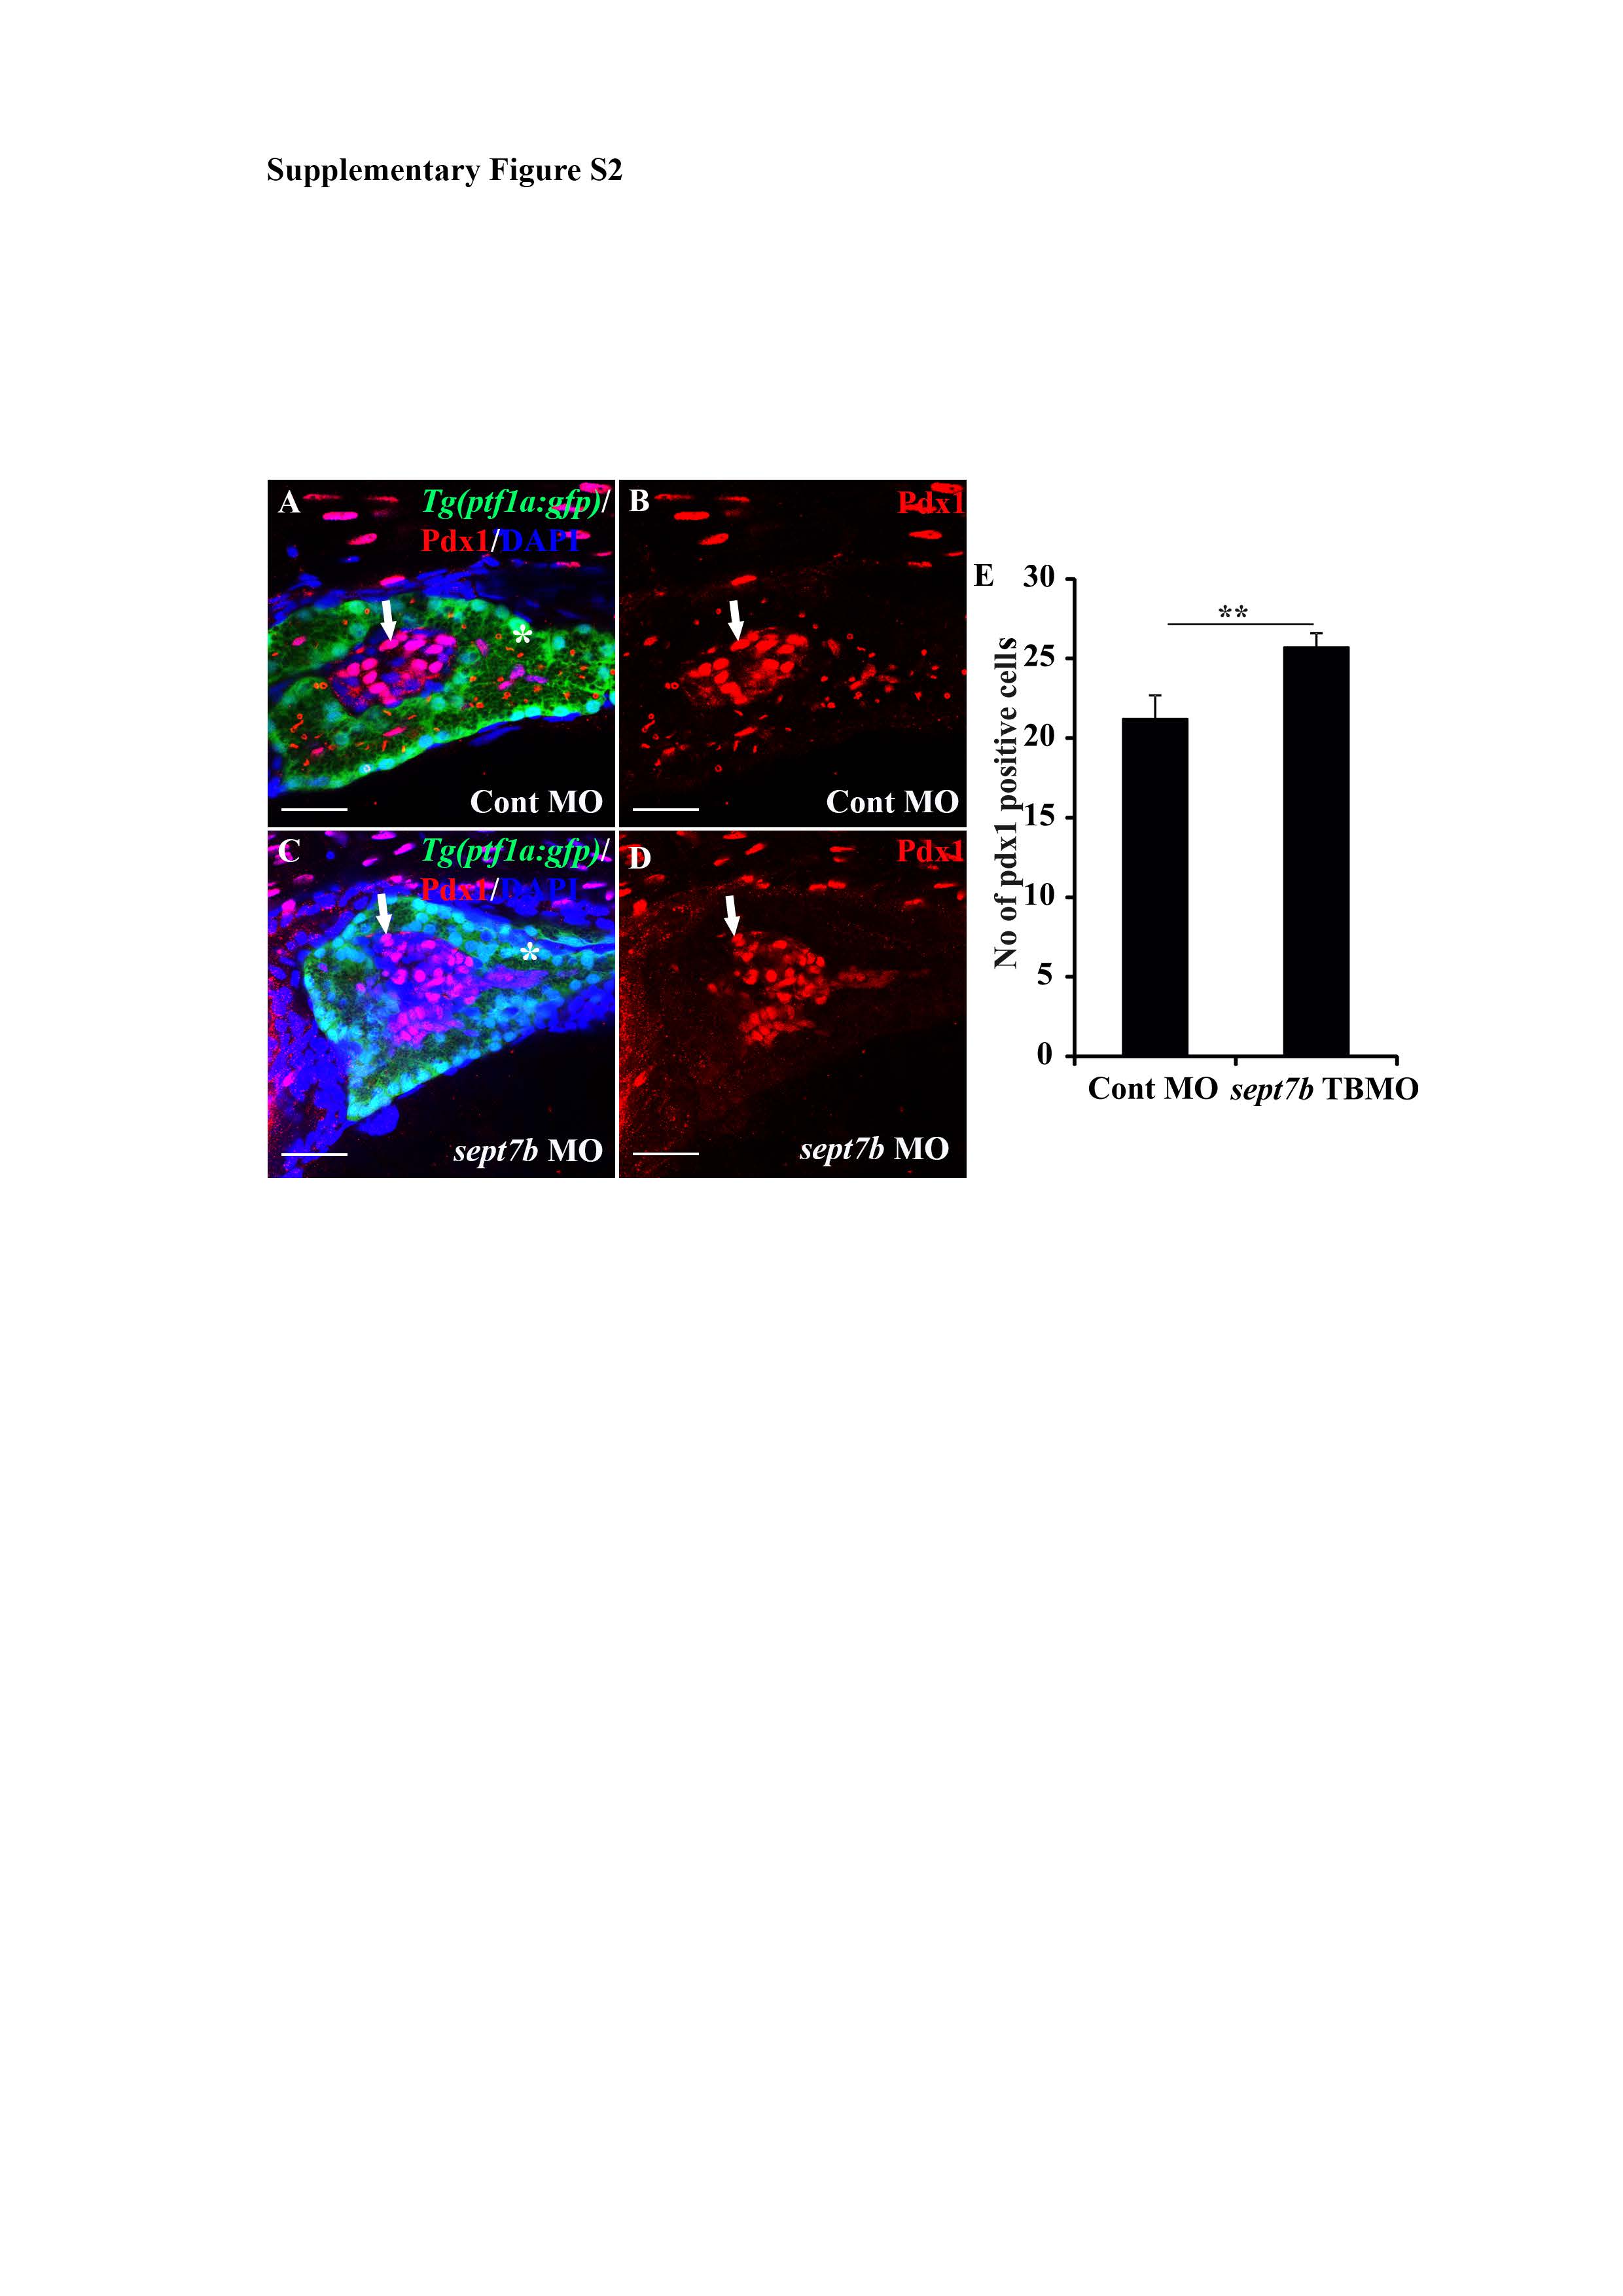
Pdx1-positive pancreatic cells are increased in sept7b knockdown larvae at 5 dpf. (A-D) Pdx1-positive cells (red; arrows) in control MOinjected (A-B) and sept7b TBMO-injected (C-D) Tg(ptf1a:GFP) zebrafish larvae at 3 dpf. In (A) and (C) the exocrine pancreas is visualized by ptf1a (green) and the nuclei are labeled with DAPI (blue). (B) and (D) are corresponding images visualizing Pdx1 only. Asterisk (*) marks the exocrine pancreas. (E) Pdx1-positive cells are significantly increased in sept7b knockdown larvae compared to control MO-injected larvae. Error bars represent mean ± SEM. ** p≤ 0.005. Scale bar: A-D (25 μm).