
Fig. 1
- ID
- ZDB-IMAGE-170914-21
- Genes
- Publication
- Nguyen-Chi et al., 2017 - TNF signaling and macrophages govern fin regeneration in zebrafish larvae
- All Figures
- Figures for Nguyen-Chi et al., 2017
|
Fig. 1
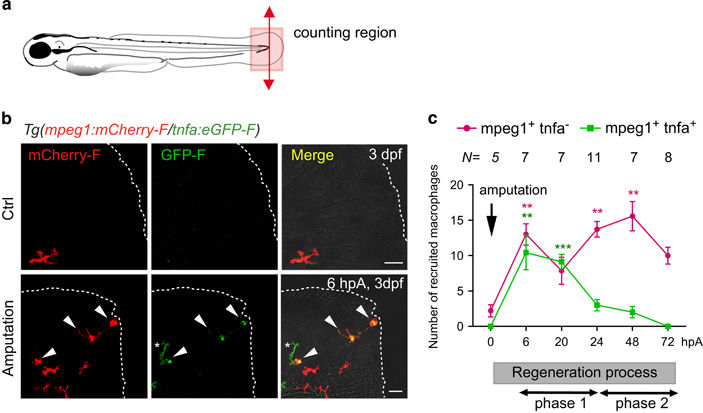
Tnfa+ and tnfa− macrophages are differentially recruited during caudal fin regeneration in zebrafish larvae. (a) Diagram showing the amputation plan (red arrow) and the counting region (pink box) in the 3 dpf larvae. (b) Caudal fin of Tg(mpeg1:mCherry-F/ tnfa:eGFP-F) were amputated at 3 dpf as shown in A and mCherry-F and GFP-F expressions were analyzed by confocal microscopy at 6 hpA in either intact (Ctrl) or amputated fins. Fin images are representative maximum projections of single fluorescence channels (mCherry-F, GFP-F) and overlay of fluorescences with transmitted light images (Merge). Arrowheads show mCherry-F+GFP-F+ cells and asterisk GFP-F+ cell, dotted lines outline the fin. Scale bar=20 μm. (c) Number of tnfa+ and tnfa− macrophages recruited to the wound region at indicated time points post amputation over 3 days. The number of larvae (N) used at each time point is indicated on the top of the graph. **P< 0.01 and ***P<0.001 indicated time point versus 0 hpA. Below the graph, a sketch of the different phases of recruitment of macrophage subsets: the M1-like macrophages accumulate during the early phase of regeneration (phase 1), whereas M2-like macrophages peaked at a later stage of the process (phase 2)