
Fig. 8
- ID
- ZDB-IMAGE-170908-16
- Publication
- Breau et al., 2017 - Extrinsic mechanical forces mediate retrograde axon extension in a developing neuronal circuit
- All Figures
- Figures for Breau et al., 2017
|
Fig. 8
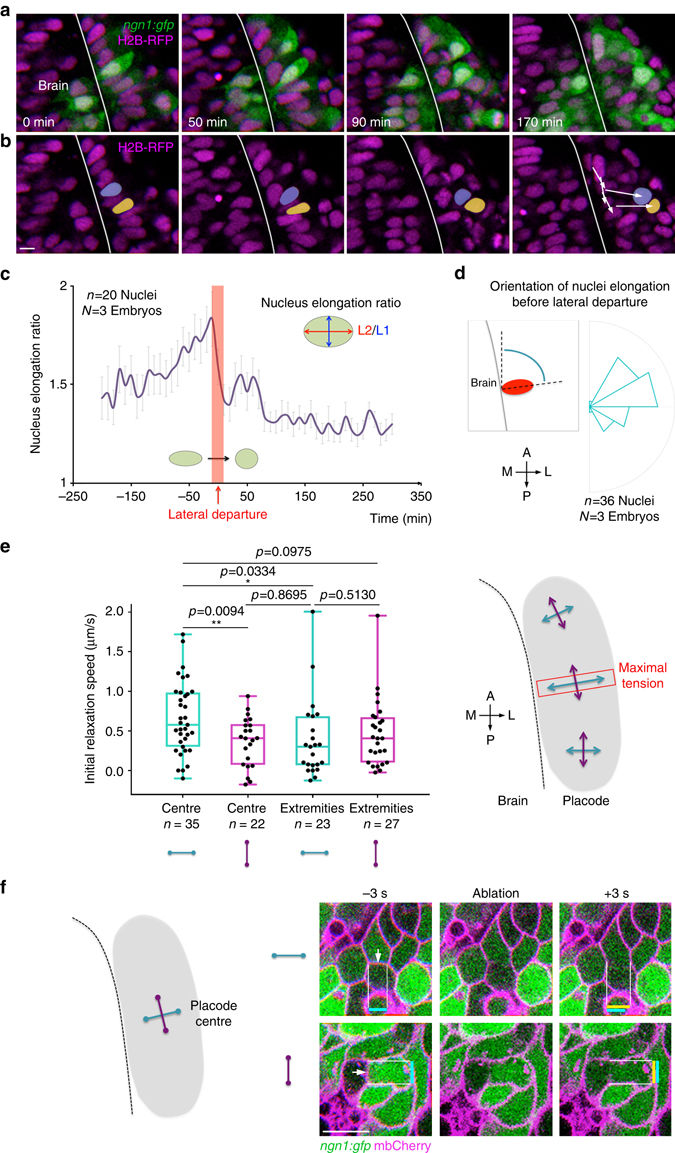
Nuclei deformation patterns and mapping of mechanical tension with laser ablation of cell/cell contacts. a, b Images extracted from a movie performed on a ngn1:gfp embryo injected with H2B-RFP mRNA. In the centre of the placode, the nuclei of cells are initially highly deformed and elongated along the ML axis. In b, the nuclei of two cells undergoing lateral movements, drawn in yellow and purple, retrieve a round morphology right after their lateral departure. c Quantification of changes in nuclei elongation ratio before, during and after the lateral departure of OP cells, showing that lateral departure coincides with a decrease in the elongation ratio (averaged on n = 20 nuclei from N = 3 embryos). d Rose plot showing the angle of nuclei elongation right before their lateral departure (n = 36 nuclei from N = 3 embryos). e Laser ablation of cell/cell contacts was performed around 16 s, in OP extremities and in the placode centre, on interfaces oriented parallel (purple) or perpendicular (blue) to the brain surface. Graphs show the initial relaxation speed, used as a proxy for the interface tension, in different locations and orientations. The highest tension was measured in the OP centre, along intercellular contacts that are perpendicular to the brain. n indicates the number of ablated cell/cell interfaces in each condition (data pooled from seven experiments). The schematic view on the right summarises the results. p values: two-tailed unpaired t-test. f Representative examples of ablation of cell/cell contacts in the OP centre, oriented perpendicular and parallel to the brain surface. The white arrows indicate the ablated cell/cell contacts. Coloured bars show the vertex–vertex distance before (blue) and right after (yellow) ablation. Scale bars: 10 µm