
Fig. 2
- ID
- ZDB-IMAGE-170908-10
- Publication
- Breau et al., 2017 - Extrinsic mechanical forces mediate retrograde axon extension in a developing neuronal circuit
- All Figures
- Figures for Breau et al., 2017
|
Fig. 2
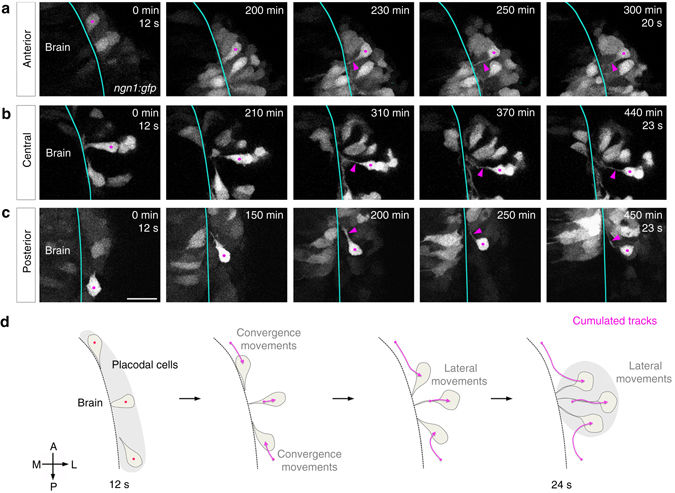
Analysis of cell morphologies during OP morphogenesis. Images extracted from movies on stable a, c or transient b ngn1:gfp transgenic embryos, showing the movement and morphologies of anterior a, central b and posterior c OP cells. Magenta dots label cell bodies of neurons of interest (strongly GFP+) and magenta arrowheads point to their protrusions contacting the brain. Scale bar: 25 µm. d Schematic representation of the cell morphologies observed during OP morphogenesis for cells from different AP positions, and the associated cumulated tracks (magenta arrows). Grey regions represent the initial and final shapes of the OP. All images represent dorsal views