
|
Fig. S2
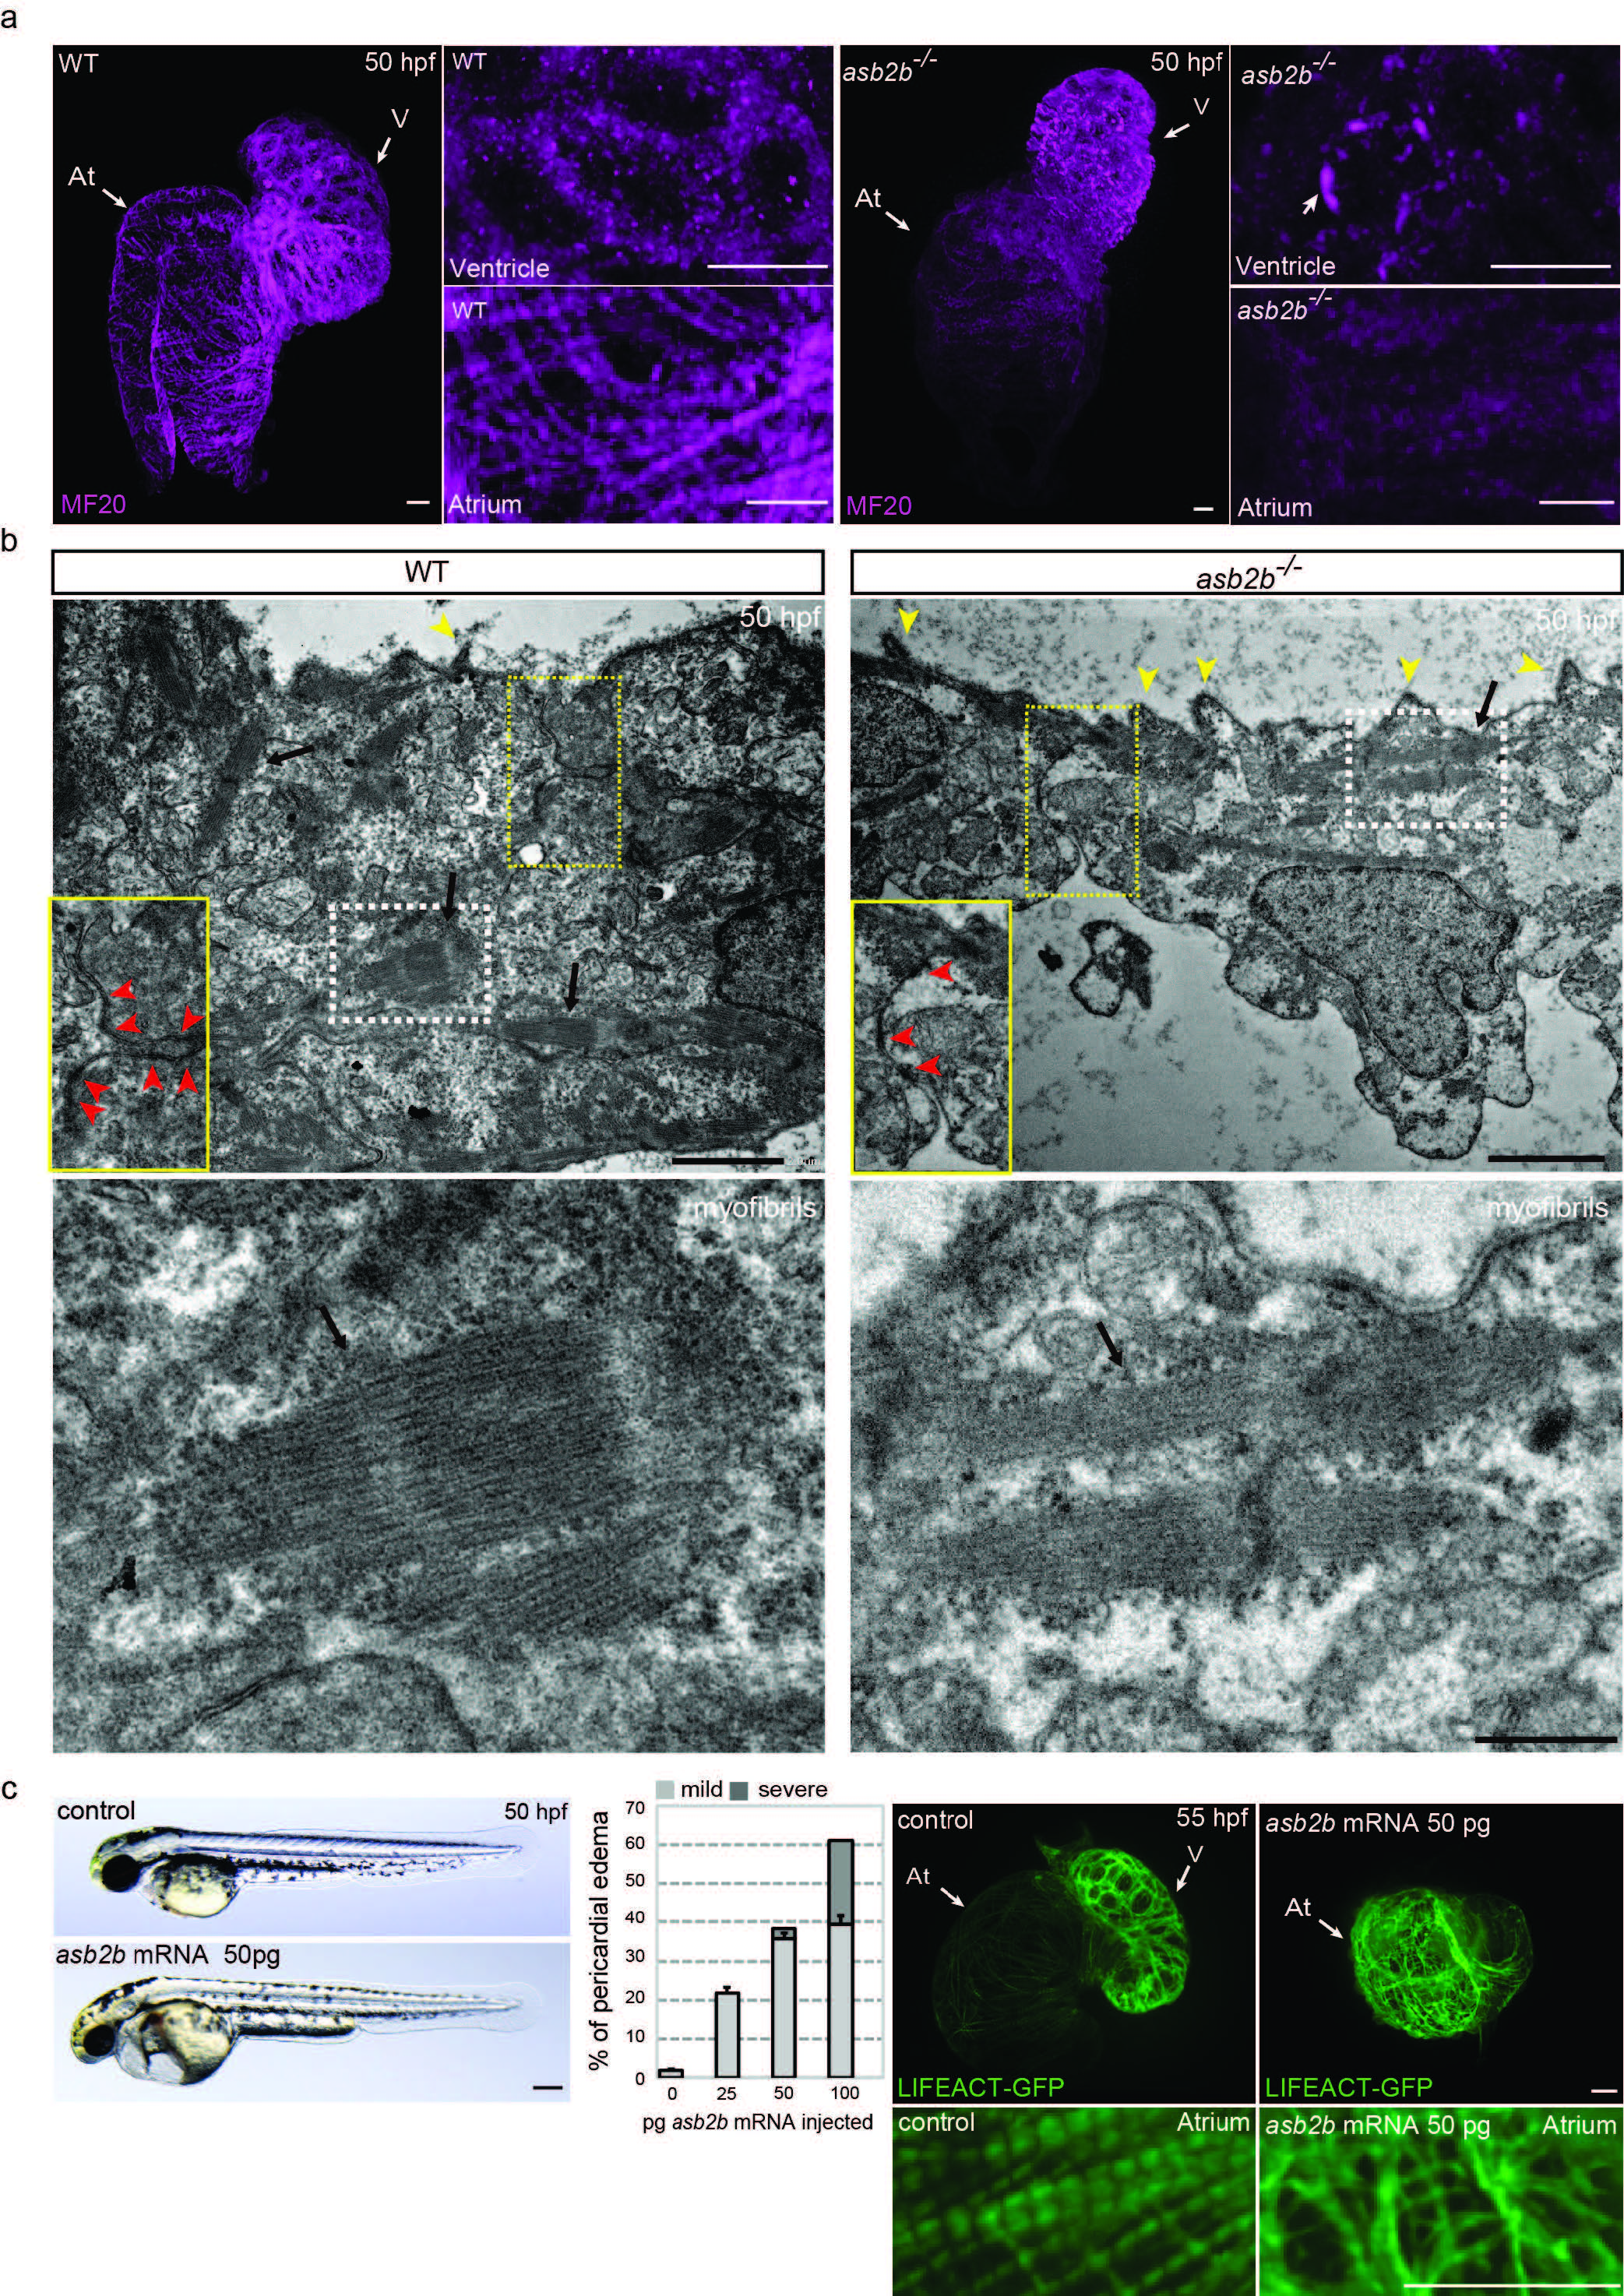
asb2b is involved in myofilament organization.
(a) 3D images of 50 hpf WT and asb2b mutant hearts stained with myosin heavy chain antibody (MF20). At, atrium; V, ventricle. Cardiomyocytes in the WT ventricle exhibit cortical myosin localization, while those in asb2b mutants show less cortical localization of myosin and exhibit punctae of myosin (arrow). WT atrial cardiomyocytes exhibit clear myofilaments, whereas fewer myofilaments are observed in asb2b mutants. (b) Electron micrographs of 50 hpf WT and asb2b mutant ventricles. Close-up views of the cardiomyocyte cell-cell contact regions in yellow dotted boxes are shown (yellow squares with red arrowheads). Ventricular cardiomyocytes in asb2b mutants exhibit fewer regions of cell-cell contact (red arrowheads). asb2b mutant cardiomyocytes exhibit many more membrane protrusions (yellow arrowheads) compared to WT. Scale bars, 2 μm. Magnified views of myofilaments in white dotted boxes are shown (black arrows). Scale bar, 0.5 μm. (c) Lateral views of a 50 hpf control embryo and an embryo injected with 50 pg asb2b mRNA. Anterior to the left. Scale bar, 200 μm. Number of fish showing pericardial edema (n=60 fish). 1-cell stage embryos were injected with different amounts of asb2b mRNA and analyzed at 55 hpf. 3D images and close-up views of Tg(myl7:LIFEACT-GFP) hearts of 55 hpf embryos injected with 50 pg asb2b mRNA. At, atrium; V, ventricle. Error bars, SEM. Scale bars, 20 μm.