
Fig. 3
- ID
- ZDB-IMAGE-170907-60
- Publication
- Fukuda et al., 2017 - Proteolysis regulates cardiomyocyte maturation and tissue integration
- All Figures
- Figures for Fukuda et al., 2017
|
Fig. 3
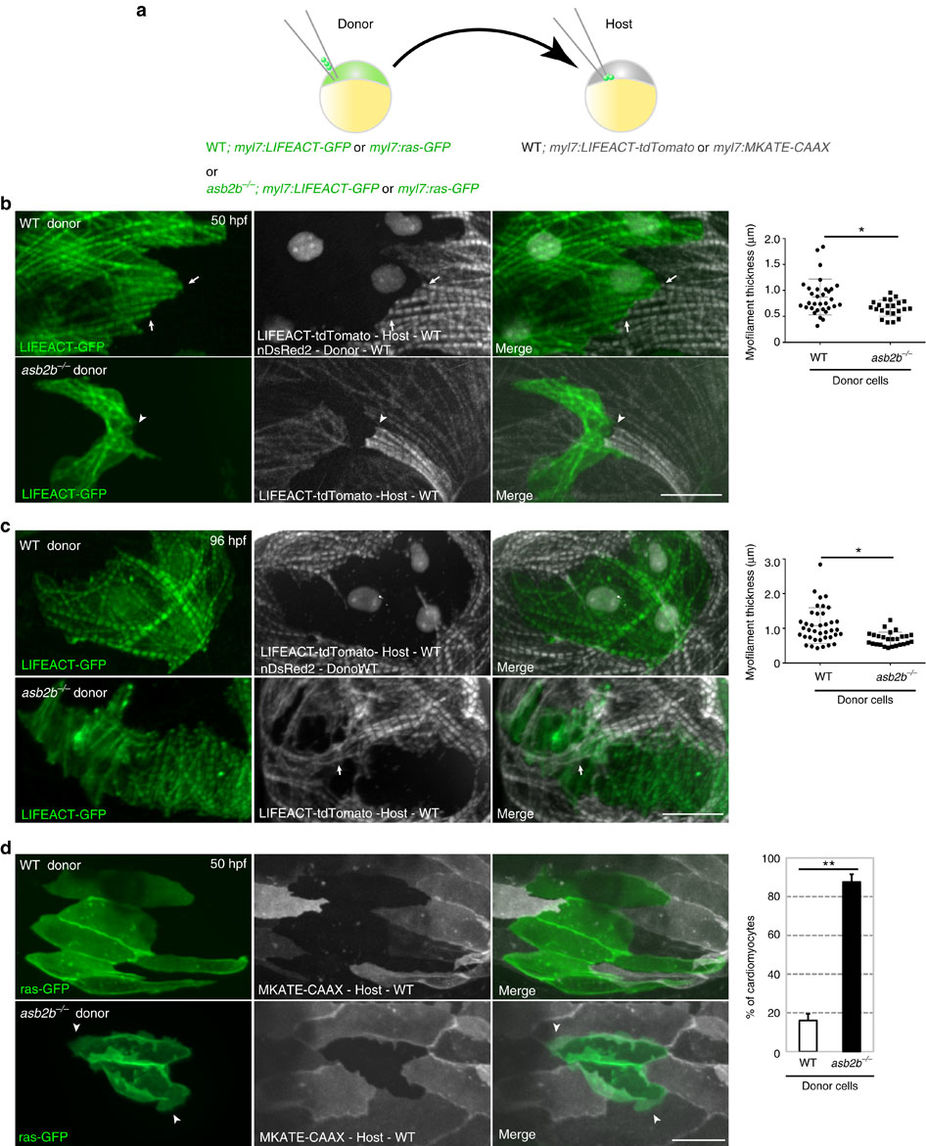
asb2b functions cell autonomously in cardiomyocytes.
(a) Schematic representation of the transplantation experiments. (b) Three-dimensional images of 50 hpf chimeric atria. Tg(myl7:LIFEACT-GFP);Tg(myl7: nDsRed2) WT or Tg(myl7:LIFEACT-GFP) asb2b mutant donor cells were transplanted into Tg(myl7:LIFEACT-tdTomato) WT host embryos. WT donor cardiomyocytes show integration of the myofilaments into WT hearts (arrows), whereas those from asb2b mutants fail to meld into WT hearts (arrowheads). Myofilament thickness was measured in 50 hpf WT and asb2b mutant donor cardiomyocytes (n=32 (WT) and 22 (mutant) myofilament from 5 hearts). (c) Three-dimensional images of 96 hpf chimeric atria. asb2b mutant cardiomyocytes in WT hearts fail to integrate their myofilaments with those of adjacent cardiomyocytes. WT host cardiomyocytes appear to establish their myofilaments underneath asb2b mutant cardiomyocytes (arrows). Myofilament thickness was measured in 96 hpf WT and asb2b mutant donor-derived cardiomyocytes (n=39 (WT) and 26 (mutant) myofilament from 5 hearts). (d) Three-dimensional images of 50 hpf chimeric atria resulting from transplanting WT or asb2b mutant cells from Tg(myl7:ras-GFP) donors into Tg(myl7:MKATE-CAAX) WT hosts. asb2b mutant cardiomyocytes exhibit abnormal membrane protrusions (arrowheads). Number of WT and asb2b mutant donor-derived cardiomyocytes exhibiting membrane protrusions in 50 hpf WT hearts (n=5 hearts, with averages taken from 30 cardiomyocytes per heart.). *P<0.05 and **P<0.01 by one-way analysis of variance (ANOVA) followed by Tukey’s honest significant difference test. Error bars, s.e.m. Scale bars, 20 μm.