
Image
|
Figure Caption
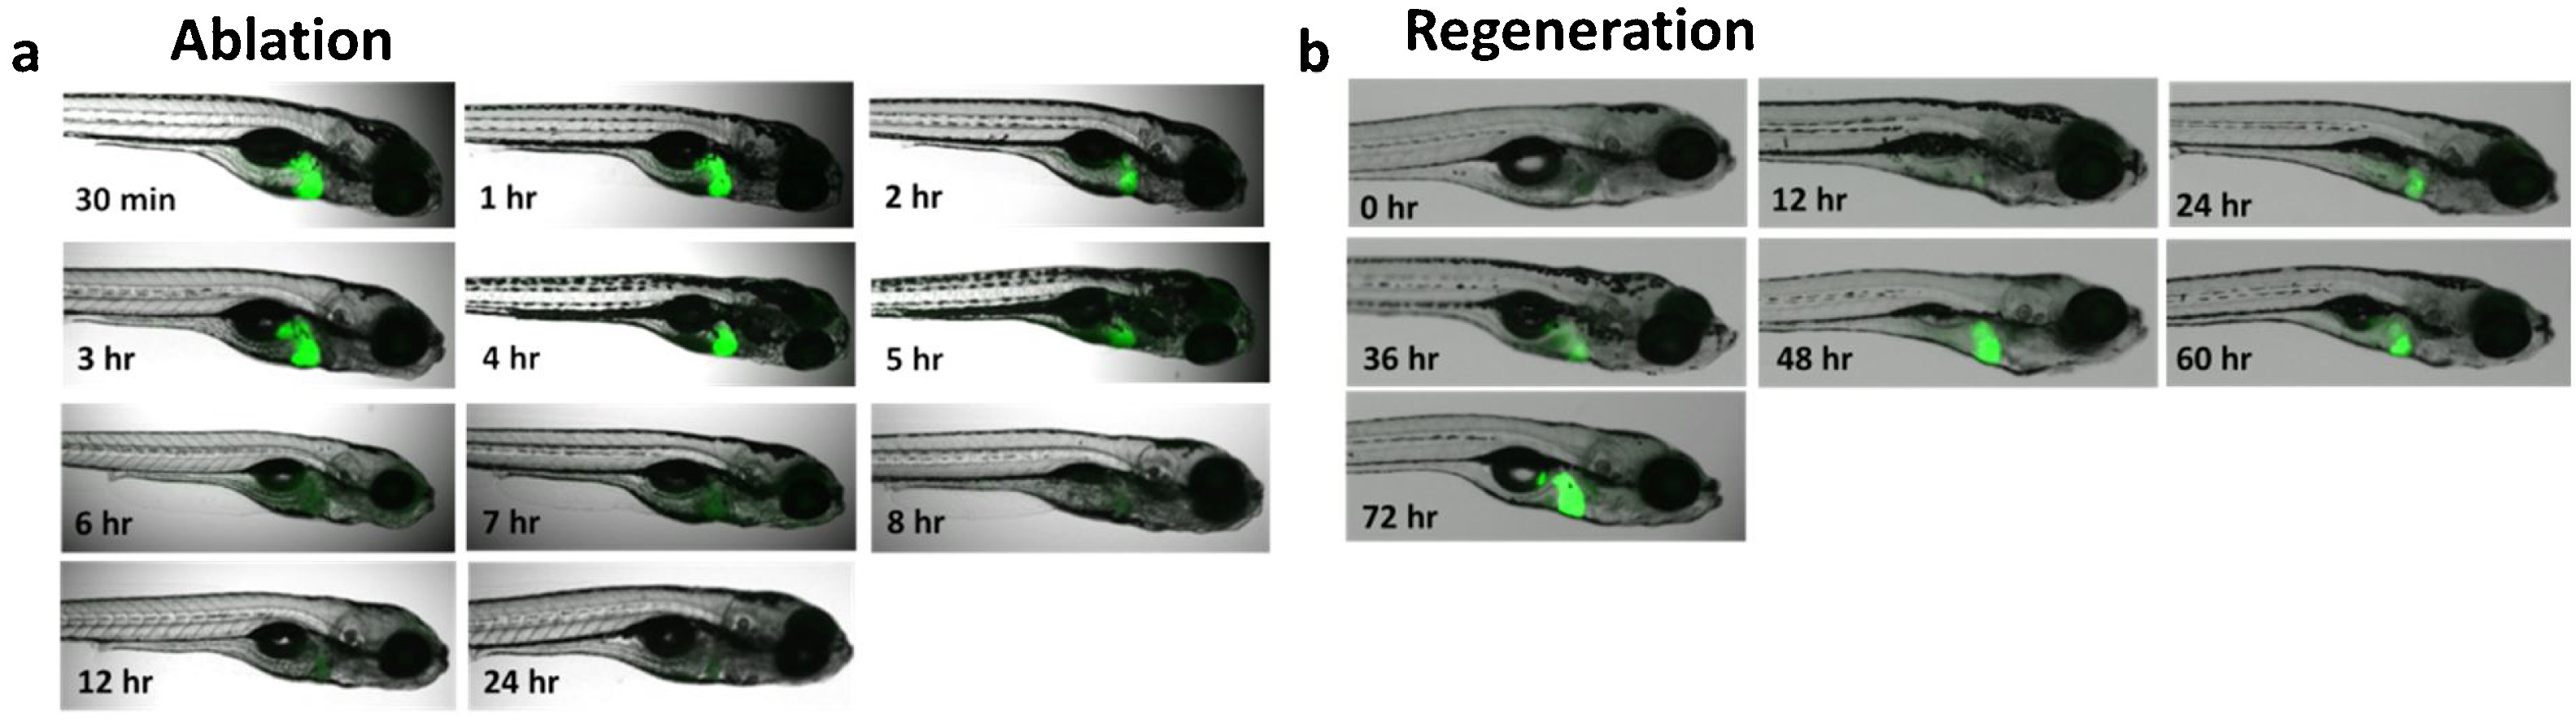
Fig. 3
Time course of tissue ablation (a) and regeneration (b) using 10 mM metronidazole (MTZ) in the hepatocytes of Tg(l-fabp:CFP-NTR)s891 zebrafish. For the ablation study, embryos were dosed at 96 hpf with 10 mM MTZ, and ablation was evaluated by visible fluorescence, following continuous exposure until the indicated time point. For the regeneration study, embryos were exposed to 10 mM MTZ from 96 to 120 hpf, then rinsed and moved to clean media, with imaging at the indicated time points after MTZ removal. The presence of hepatocytes is indicated by green fluorescence.
Acknowledgments
This image is the copyrighted work of the attributed author or publisher, and
ZFIN has permission only to display this image to its users.
Additional permissions should be obtained from the applicable author or publisher of the image.
Full text @ Toxicol Rep