
|
Fig. S4
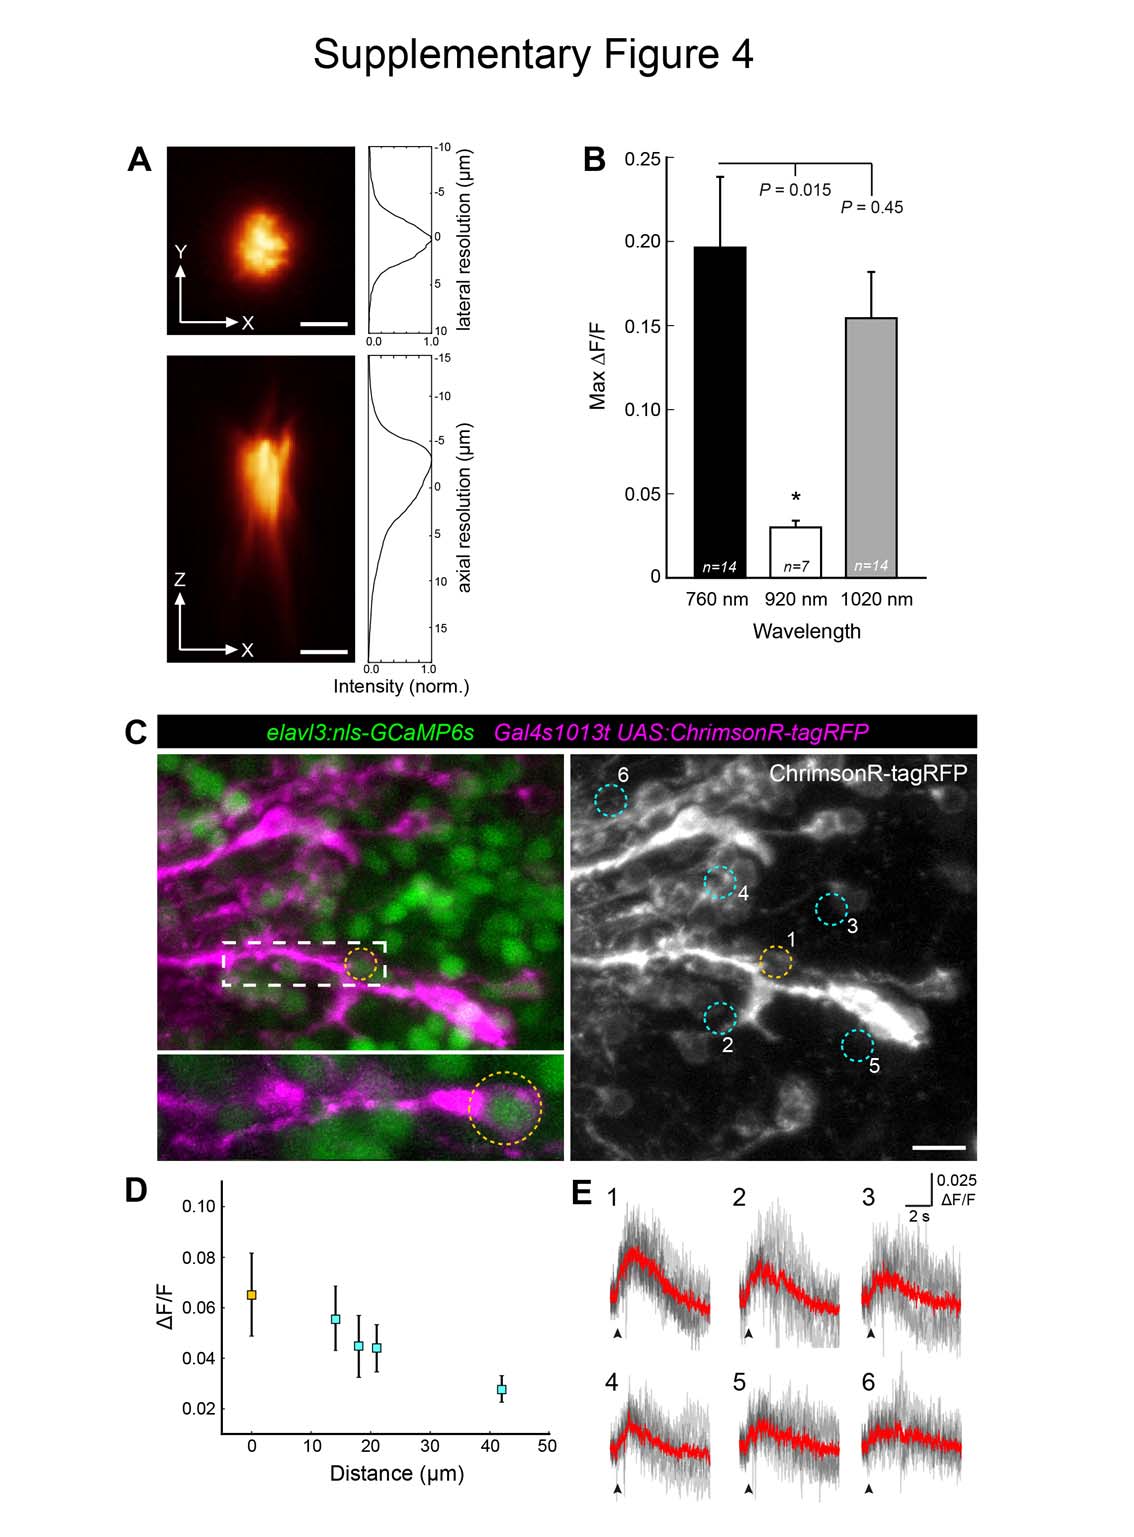
Characterization of 2P holography photostimulation. (A) Axial (top) and lateral (bottom) extension of a circular illumination pattern with a diameter of 6 μm. 960 nm light was used to excite a thin layer of Fluorescein solution (0.2 mW μm-2). Axial and lateral intensity profiles are shown on the right. Scale bar, 5 μm. (B) Maximum calcium responses obtained upon photostimulation of ChrimsonR-expressing cells using different wavelengths. Excitation of Chrimson at 760 nm resulted in relatively large responses, likely driven by a single photon absorption mechanism. Data obtained from Optobow-nPA experiments in tectal cells. Error bars indicate SEM. (C-E) Characterization of ChrimsonR photostimulation selectivity in vivo. (C) Maximum projection of a confocal stack showing tectal cells in a 6 dpf zebrafish larva with a dense expression of ChrimsonR-tagRFP (left: magenta, right: white) and pan-neuronal nls-GCaMP6s (green). A close-up single confocal slice of the targeted cell is shown below the projection. A 6 μm-diameter excitation spot was used for on-target (orange circle, #1) or off-target (cyan circles, #2-6) photostimulations at 1020 nm (200 ms), while calcium responses of cell#1 were recorded simultaneously. Scale bar, 10 μm. (D) Averaged maximum ΔF/F calcium responses obtained from on-target and off target stimulations as a function of distance between the recorded cell (#1) and the excitation spot. Error bars are SEM. (E) Raw (gray) and averaged (red) ΔF/F profiles of six excitation trials for the different spot positions indicated in (C). Stimulation time points are indicated by arrowheads.