
|
Fig. 5
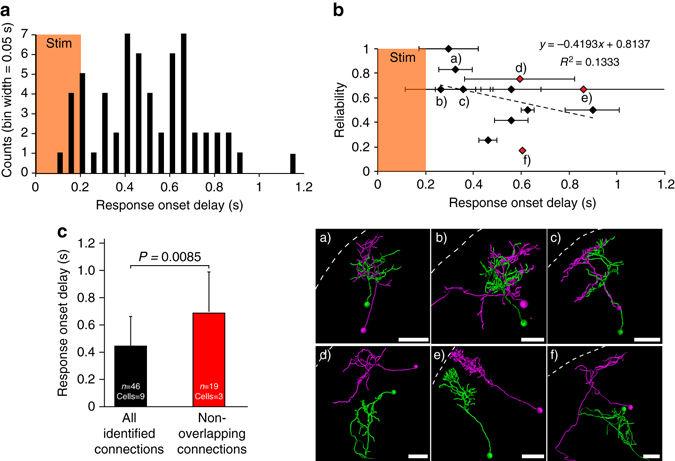
Quantification of response latencies and reliabilities. All data are derived from 5 dpf larvae expressing Optobow-nPA, using a sampling rate for calcium signals of <4.5 ms per frame. a Distribution of all response latencies. Events are grouped in temporal bins of 50 ms. Orange shaded region marks 200 ms of ChrimsonR photostimulation. Number of trials n = 65, number of cells = 12. b Individual cell response reliability vs. response onset latency. For every cell, the average response onset is represented along the X axis, while the ratio responses per trials is plotted in the Y axis. Dashed line represents a linear regression model of the data to evaluate the degree of correlation (coefficient of determination is 0.13329). Morphological analysis shown below indicates overlapping (a–c) or non-overlapping (d–f) neurite arbors of the functionally identified cell pairs. Error bars are SD. Scale bar, 20 µm. c Average response latencies of three non-overlapping cells (red data points in b) compared to all other identified responding cells. Error bars are SD