
Fig. S1
- ID
- ZDB-IMAGE-170825-38
- Publication
- Wehner et al., 2017 - Wnt signaling controls pro-regenerative Collagen XII in functional spinal cord regeneration in zebrafish
- All Figures
- Figures for Wehner et al., 2017
|
Fig. S1
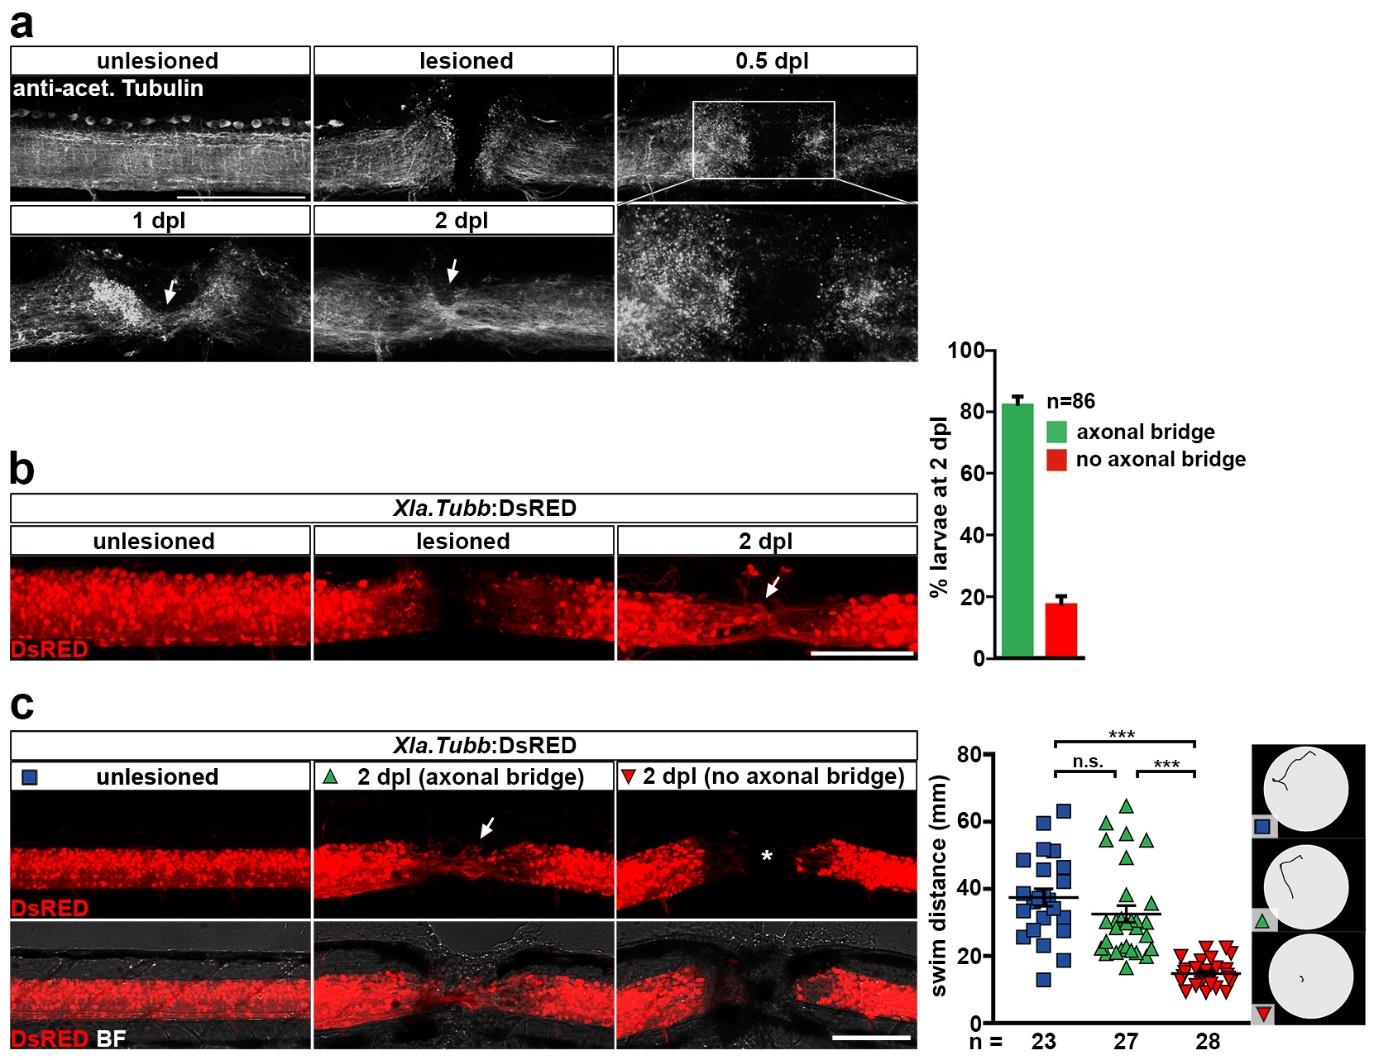
Functional spinal cord regeneration correlates with axon regrowth in zebrafish larvae.
(a) Time-course of axon regrowth (anti-acetylated Tubulin+) after spinal cord transection. Note that at 0.5 dpl (12 hpl) little axon regrowth is evident and mainly axonal debris is found in the lesion site (inset). At 1 dpl axons begin to bridge the lesion, which is has substantially progressed at 2 dpl (arrows).
(b) Repetitive imaging of Xla.Tubb:DsRED transgenic larvae shows axonal bridge formation across the lesion site (arrow) in >80% of all animals analysed. Shown is the same animal before lesion, immediately after lesion and at 2 dpl.
(c) Functional recovery, as measured by the swim distance after touch, correlates with axon regrowth across the lesion site (axonal bridge formation) in larval zebrafish. Animals with an axonal bridge at 2 dpl (arrow) cover similar swim distance as unlesioned age-matched control animals. In animals in which no axonal reconnection is established by 2 dpl (asterisk), recovery of swim distance is impaired (one-way ANOVA with Dunn’s multiple comparison test: ***P<0.001, n.s. indicates not significant). Example swim tracks are shown.
(a-c) Views are lateral (dorsal is up, rostral is left). BF: brightfield. Scale bars: 200 μm (c) and 100 μm (a-b). Error bars indicate s.e.m.