
Fig. S5
- ID
- ZDB-IMAGE-170824-46
- Publication
- Zhang et al., 2016 - Stereotyped initiation of retinal waves by bipolar cells via presynaptic NMDA autoreceptors
- All Figures
- Figures for Zhang et al., 2016
|
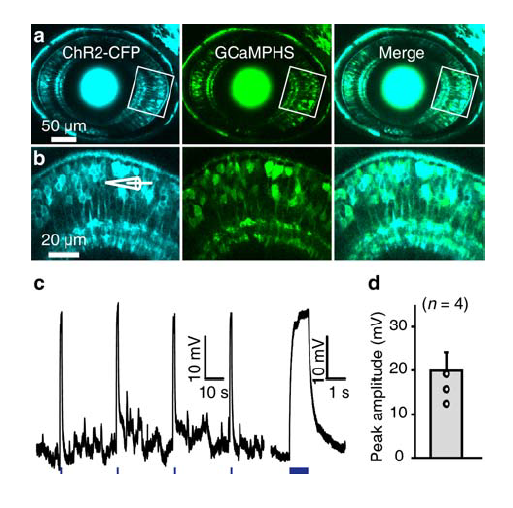
Fig. S5
Co-expression of ChR2-CFP and GCaMPHS in BCs.
(a) Confocal images showing the co-expression of ChR2-CFP and GCaMPHS in BCs of a 3-dpf Tg(Ribeye:ChR2-CFP,Gal4-VP16xfz43,UAS:GCaMPHS) larva.
(b) Enlarged view of the boxed region in (a).
(c) Depolarization of BCs in response to optogenetic stimulation (1 s in duration, 440 nm in wavelength, marked with blue lines at bottom). Right, the first depolarization response at a higher time resolution.
(d) Summary of optogenetic activation-induced BC responses, which are much larger than light-evoked BC responses (see Supplementary Figure 1c). Data are represented as mean ± s.e.m.