
Fig. 3
- ID
- ZDB-IMAGE-170823-15
- Publication
- Wang et al., 2016 - Wars2 is a determinant of angiogenesis
- All Figures
- Figures for Wang et al., 2016
|
Fig. 3
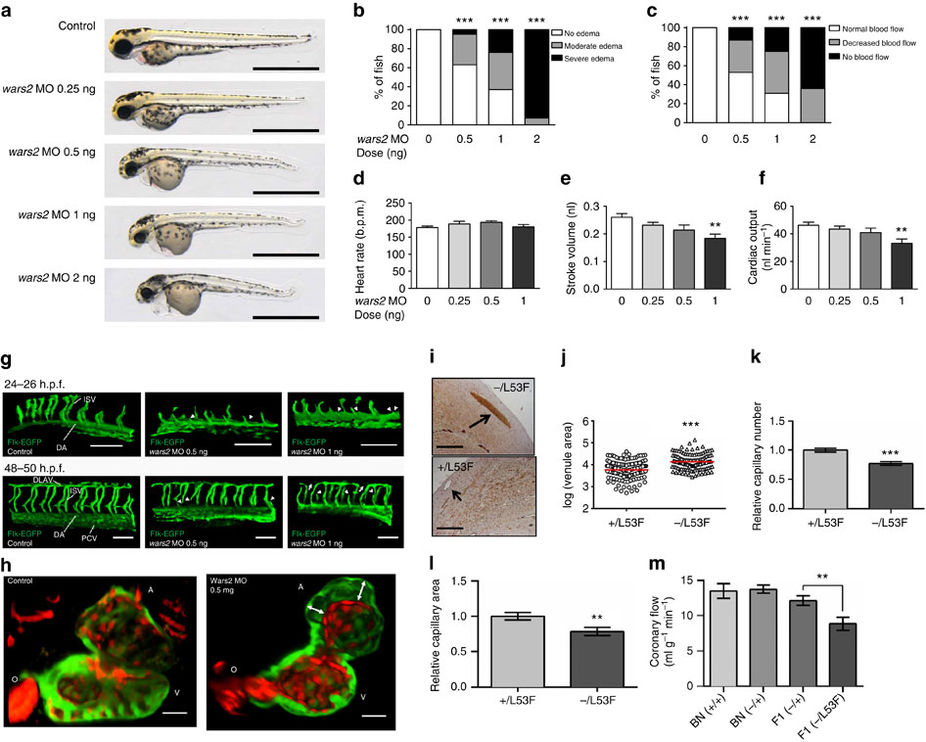
Effects of inhibition of wars2 in the zebrafish and rat.
(a) Zebrafish embryos injected with morpholinos (MO; 0.5 ng, 1 ng or 2 ng) against wars2 or non-targeting MO (Control) and imaged at 72 h post fertilization (72 hpf). Scale bar=1 mm. (b, c) Percentage of fish with cardiac oedema (b) and normal, decreased or absent blood flow (c) at 72hpf. n=55, 62, 54, and 42 fish for doses of 0, 0.5, 1, and 2 ng wars2 MO, respectively; Chi-square test. (d–f) Inhibition effect of wars2 on heart rate (d), cardiac stroke volume (e) and cardiac output (f). n=15, 13, 16, and 15 fish for doses of 0, 0.25, 0.5, and 1 ng wars2 MO, respectively; Dunnett’s multiple comparison test after one-way analysis of variance (ANOVA). (g) 3D reconstruction of 2-photon Z-stack images of 24–26 hpf (top) and 48–50 hpf (bottom) Tg(flk:EGFP) transgenic zebrafish embryos. Green fluorescent trunk vessels are shown from controls and embryos with 0.5 or 1 ng of the wars2 morpholino. Defects of intersegmental vessels (ISV, arrowheads) become obvious at 24 h.p.f.; disruptions of dorsal longitudinal anastomotic vessels (DLAV, arrows) occur at 48 hpf Fish anterior end is located to the left in all images. DA: dorsal aorta; PCV: posterior cardinal vein. Scale bar=100 μm. (h) Optical slice through 3D-reconstructed images of hearts of zebrafish embryos 5 days post fertilization using in vivo 2-photon microscopy. Tg(myl7:GFP;flk:dsRed) zebrafish, showing green fluorescence in myocardium and red fluorescence in endocardium, with separation (arrows) of cell layers after wars2 knockdown (a: atrium, o: outflow tract, v: ventricle.). Scale bar, 30 μm. (i–m), Effects of Wars2 loss-of-function on capillary density and coronary flow in rat heart. (i) Histological section of rat hearts stained for CD31 showing very large sub-epicardial veins in F1(Wars2−/L53F) rats but not F1(Wars2+/L53F) rats. Scale bar=500μm. (j) Sub-epicardial venule areas (log scale, arbitrary units) in F1 rats (n=5, red line, mean). (k) Relative capillary density in F1 rats (n=5). (l) Relative capillary area in the heart F1 rats (n=5). (m) Ex vivo quantification of coronary flow under paced conditions in wild-type BN(Wars2+/+), n=9; BN(Wars2−/+), n=7; F1(Wars2+/L53F), n=7 and F1(Wars2−/L53F), n=11. j–i, t-test; m, one-way ANOVA with Tukey's multiple comparisons test. **P<0.01; ***P<0.001.