
Fig. 1
- ID
- ZDB-IMAGE-170815-23
- Genes
- Publication
- Mazon-Moya et al., 2017 - Septins restrict inflammation and protect zebrafish larvae from Shigella infection
- All Figures
- Figures for Mazon-Moya et al., 2017
|
Fig. 1
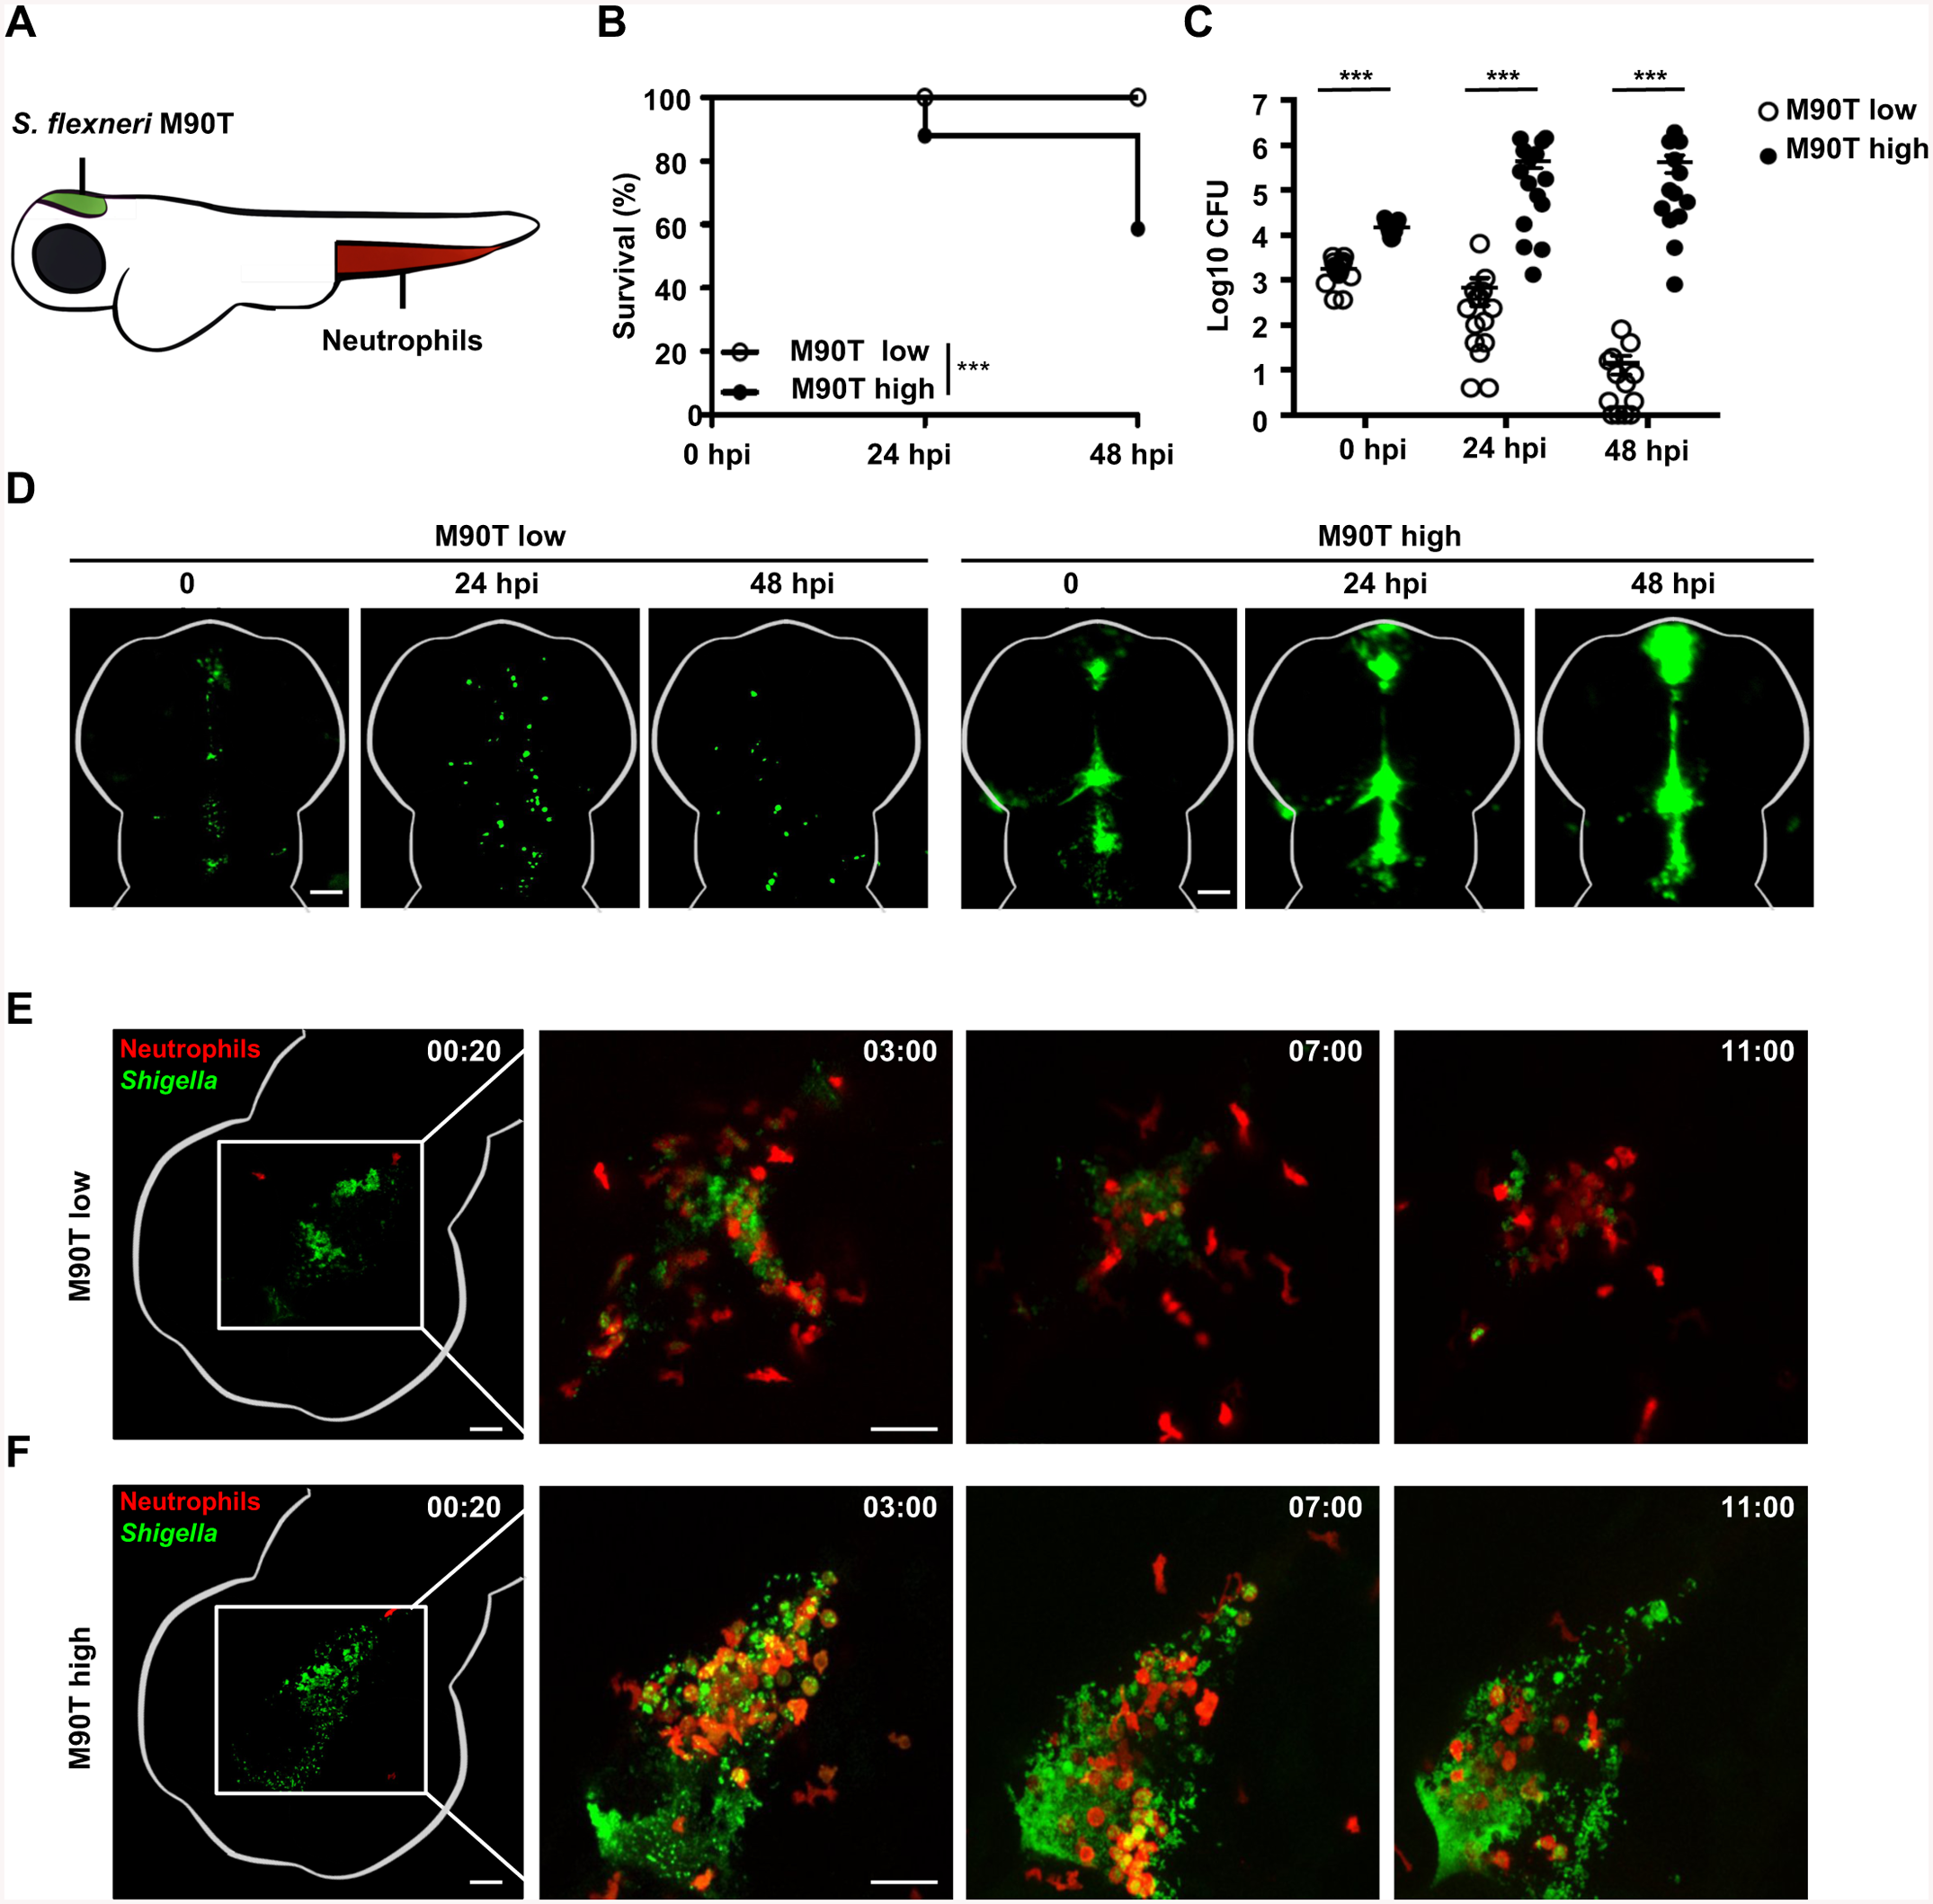
S. flexneri infection of the zebrafish hindbrain ventricle.
A. Cartoon of zebrafish larva (3 dpf) showing localization of neutrophils prior to infection (red) and the site of S. flexneri M90T (green) injection in the HBV. B. Survival curves of larvae infected with a low (≤ 3 x 10³ CFU) or high (≥ 1 x 10⁴ CFU) dose of S. flexneri M90T. Pooled data from 5 independent experiments per inoculum class using at least 15 larvae per experiment. Significance testing performed by Log Rank test. ***, P<0.001. C. Enumeration of bacteria at 0, 24, or 48 hpi from surviving larvae infected with a low (open circles) or high (closed circles) dose of S. flexneri M90T. Pooled data from 5 independent experiments per inoculum class using up to 3 larvae per treatment. Circles represent individual larvae, and only larvae having survived the infection (thus far) included here (i.e., dead larvae not homogenised for counts). Mean ± SEM also shown (horizontal bars). Significance testing performed by Student’s t test. ***, P<0.001. D. Representative images of larvae infected in the HBV with low or high dose of GFP-S. flexneri M90T. For each dose, the same larva was imaged at 0, 24, and 48 hpi using a fluorescent stereomicroscope. Scale bars, 100 μm. E-F. Representative frames extracted from in vivo time-lapse confocal imaging of lyz:dsRed larvae (3 dpf, red neutrophils) injected in the HBV with a (E) low dose or (F) high dose of GFP-S. flexneri M90T. First frame 20 mpi, followed by frames at 3, 7, and 11 hpi. Maximum intensity Z-projection images (2 μm serial optical sections) are shown. Scale bars, 50 μm. See also S2 and S3 Videos.