
Fig. 1
- ID
- ZDB-IMAGE-170809-1
- Genes
- Publication
- Mesureur et al., 2017 - Macrophages, but not neutrophils, are critical for proliferation of Burkholderia cenocepacia and ensuing host-damaging inflammation
- All Figures
- Figures for Mesureur et al., 2017
|
Fig. 1
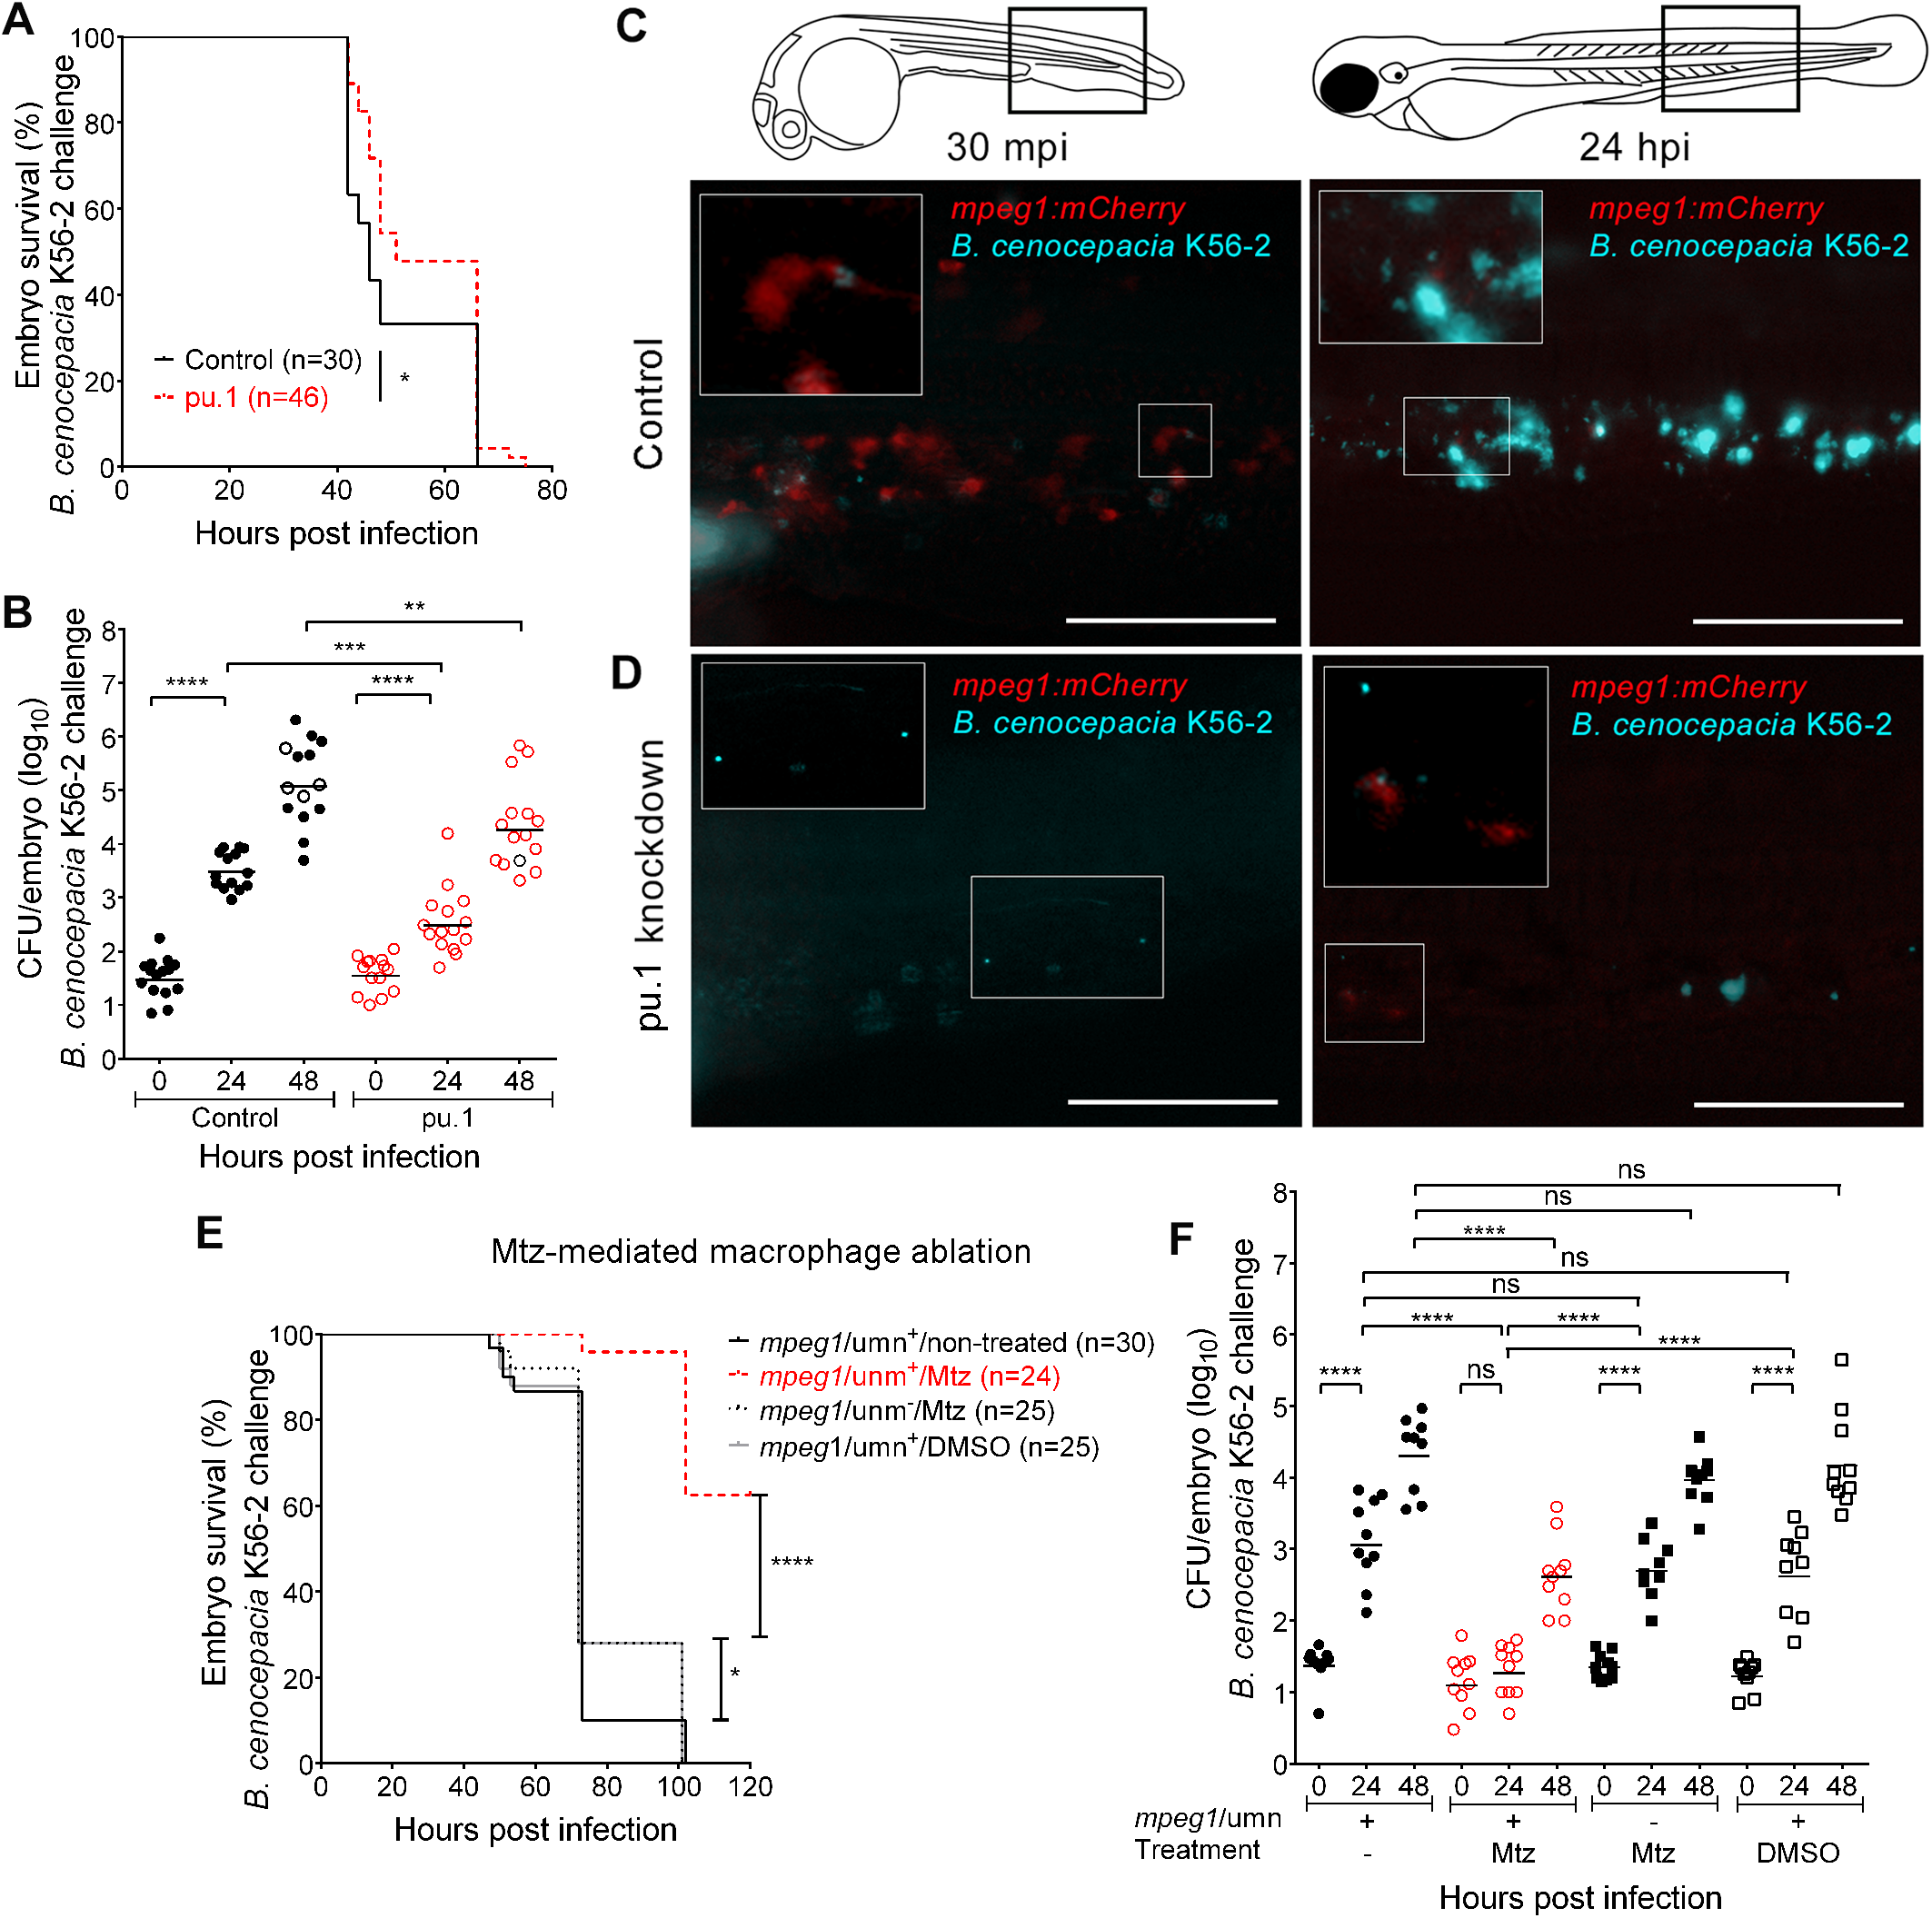
Macrophages are critical for virulence of B. cenocepacia.
(A,B) Embryo survival (average inoculum 17 CFU, representative experiment) (A) and bacterial burden (total of 3 experiments) over time (B) of control (black) and pu.1 knockdown embryos (red) injected iv with B. cenocepacia K56-2. (C,D) Representative fluorescence overlay images of an mpeg1:mCherry control and mpeg1:mCherry pu.1 knockdown embryo at 30 min and 24 h after injection with ~40 CFU B. cenocepacia K56-2 (blue). See also S2 Fig. (C) mCherry-positive macrophages (red) colocalise with K56-2 at 30 mpi, and are no longer detected at 24 hpi (insets show magnification). (D) mCherry-positive macrophages are absent in knockdown embryos at 30 mpi and start to re-appear at 24 hpi (insets show magnification). Scale bars, 100 μm. (E,F) Embryo survival (average inoculum 28 CFU, representative experiment) (E) and corresponding bacterial burden (n = 10 per group per time point). (F) of mpeg1/umn+ embryos, untreated or treated with 5mM Mtz or 0.2% DMSO, and mpeg1/umn−embryos treated with 5mM Mtz iv injected with B. cenocepacia K56-2. (B,F) Geometric means with each data point representing an individual embryo. Dead embryos marked as black open circles (not recorded for 5 embryos in (B), and in (F)). (A, B, E, F) * p ≤ 0.05, ** p ≤ 0.01, *** p ≤ 0.001; **** p ≤ 0.0001. ns: not significant. See materials and methods for statistical tests. See also S1 Fig and S3 Fig.