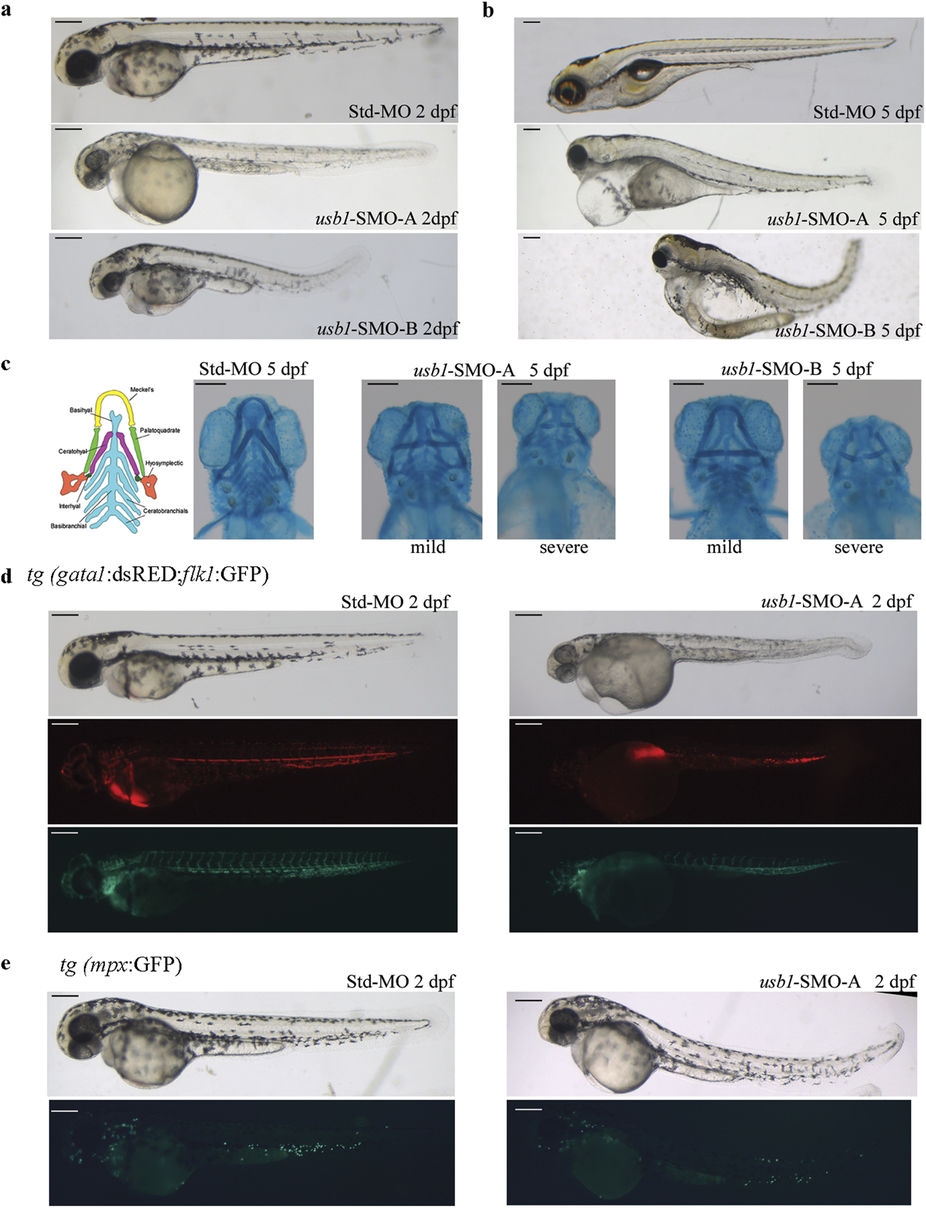
Fig. 4
Overall phenotype of usb1 morphants.
Representative live-microscopy-4X magnification-pictures of 2 dpf (a) and 5 dpf (b) embryos injected with the same dosage (0.6 pmol/embryo) of Std (top), SMO-A (central) or SMO-B (bottom) morpholinos. The morphants display a smaller size, with defective and irregular pigmentation of the skin, as compared to the continuous stripes of the control embryos, and pericardial oedema. (c) Massive skeletal defects revealed by Alcian blue staining in usb1 morphants at 5 dpf. From left to right: diagram illustrating the normal pharyngeal arches-derived bone architecture19; ventral view of a control embryo (left panel) and representative pictures of the mild (left) and severe (right) phenotypes of SMO-A and SMO-B morphants. The Meckel’s (yellow in the colour-coded diagram), the palatoquadrate (green) and ceratohyal (purple) structures appear misshaped in both mildly- and severely-affected embryos; moreover, the ceratobranchial structures (light blue) appear disorganized or missing in half of SMO-A and in a third of SMO-B severely-affected embryos. (d) Reduction of gata1-positive cells (red fluorescence) (middle panels) and a regular vasculature pattern (green fluorescence) (lower panels) in 2 dpf tg(gata1:dsRED;flk1:GFP) embryos injected with SMO-A (0.7 pmol/embryo) (right) as compared to control (left). (e) Myeloid lineage defects evinced by a reduction in mpx-positive cells (green fluorescence) (lower panels) in 2 dpf tg(mpx:GFP;lyzC:dsRED) embryos injected with SMO-A (0.7 pmol/embryo) (right) as compared to control (left). Scale bars: (a–e) 200 μm.

