
|
Fig. 3
Newborn Neurons Shift the Peak’s Position of Their Receptive Fields as They Develop
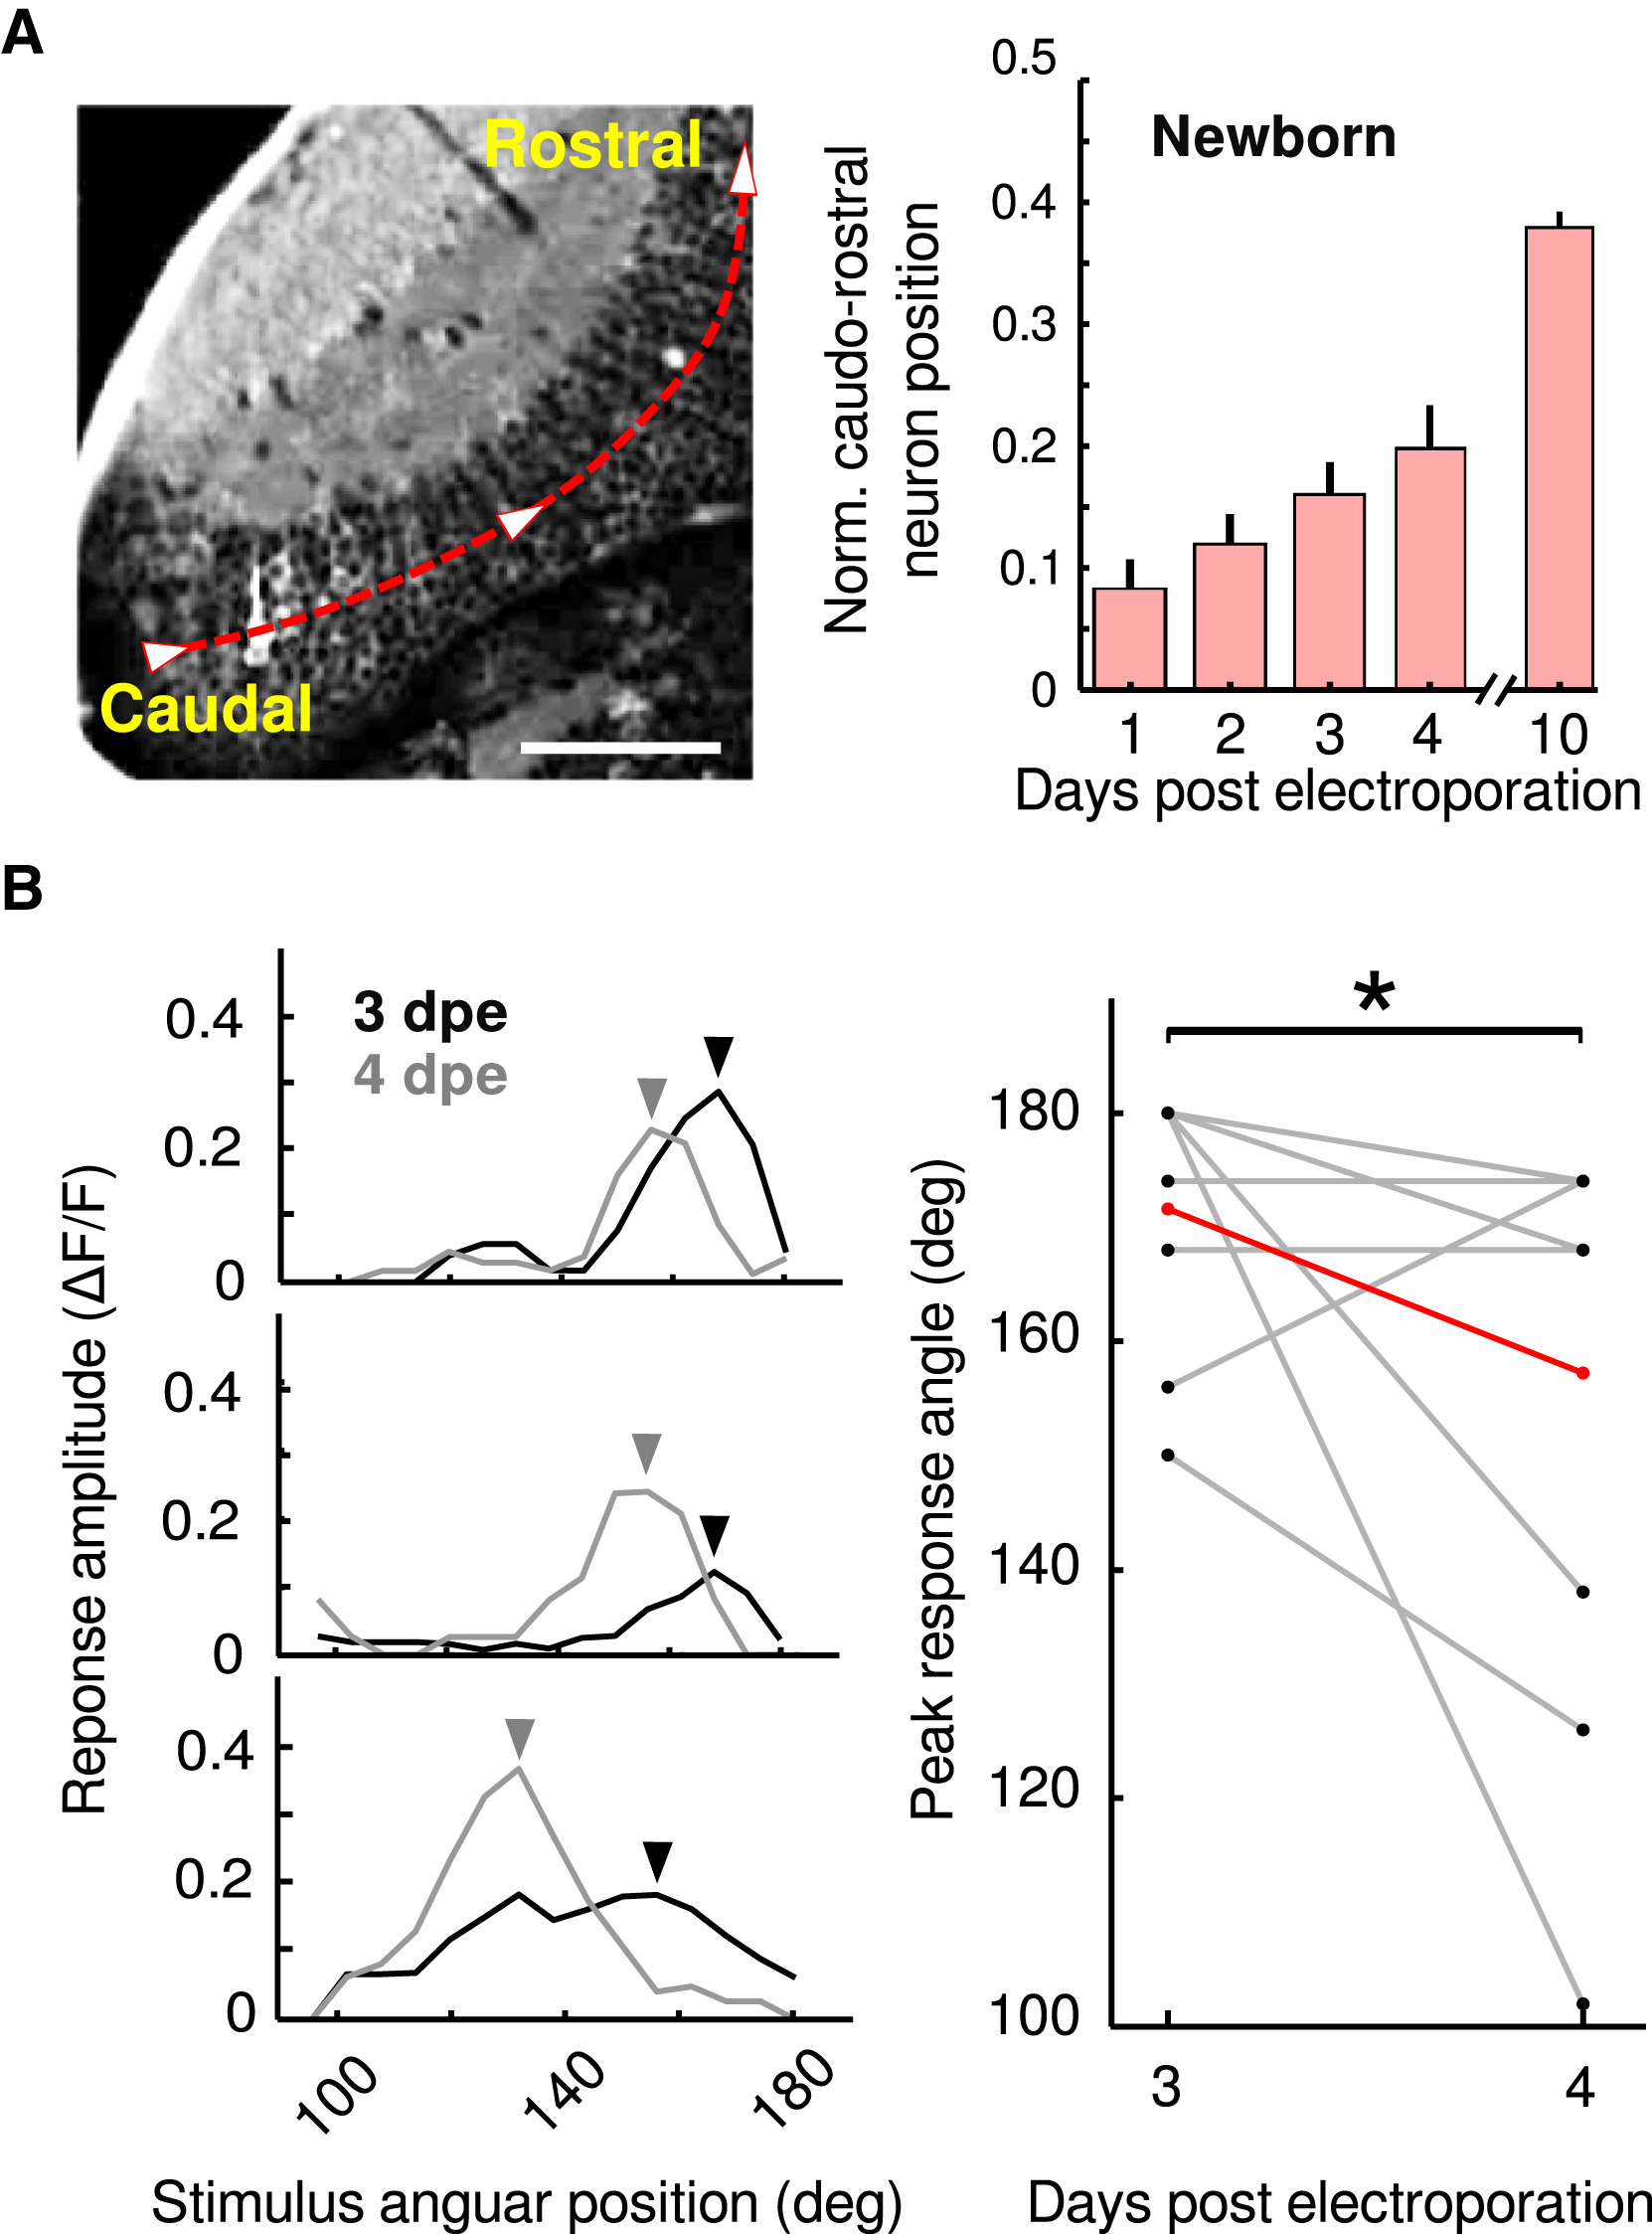
(A) Left: optical section of the optic tectum of a Tg(huC:GCaMP5G) larva showing the caudo-rostral axis (red). This axis was used for normalization of the position of neurons across recordings. The scale bar represents 50 μm. Right: the average of the normalized caudo-rostral position of newborn-labeled neurons, from 1 to 4 and 10 dpe. Note the gradual displacement of the neurons away from the neurogenesis region. The error bars represent SEM.
(B) Left: three examples of the spatial tuning curves of chronically recorded newborn-labeled neurons at 3 (black) and 4 (gray) dpe. Note the displacement of peaks of the tuning curves between 3 and 4 dpe (arrowheads). The displacement is always toward more rostral positions. Right: the angle of the stimulus that generated the strongest responses (peak) at 3 and 4 dpe. Gray lines connect the same newborn-labeled neuron imaged at 3 and 4 dpe. The red line indicates the average of the stimulus’ angle that induced the peak response. ∗p < 0.05.