
|
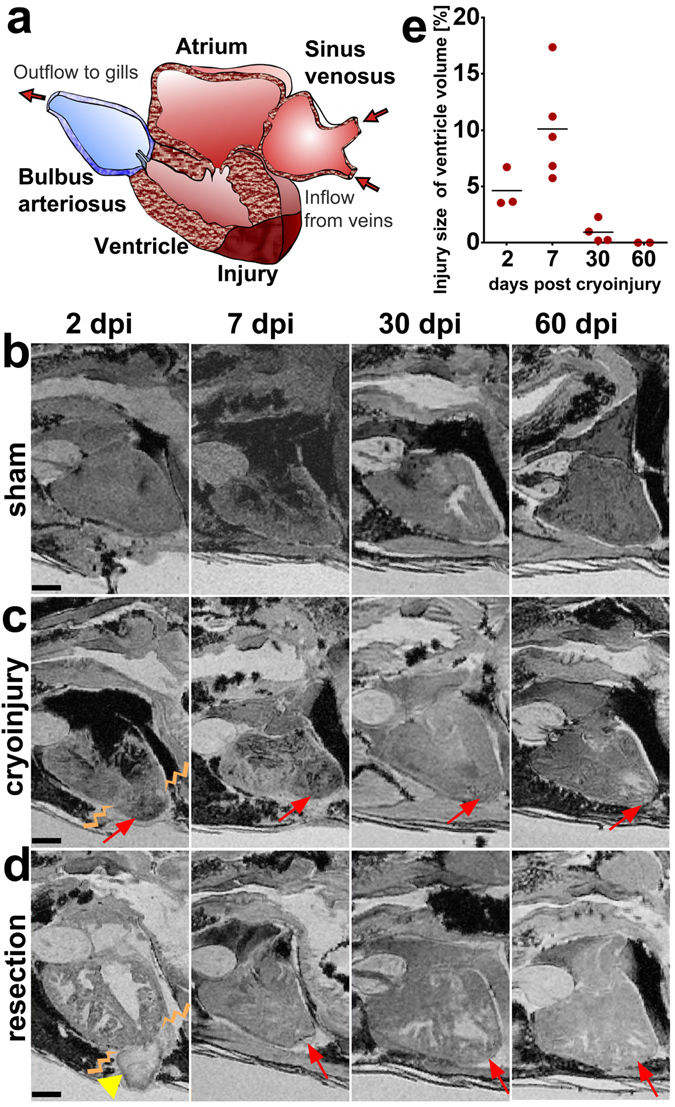
Fig. 1
Ex vivo MRI of heart regeneration in different fixed specimens. (a) Schematic drawing of the zebrafish heart in sagittal section view as in the MR images below. The apex of the ventricle is drawn with a cryoinjury to illustrate the location of the lesions. (b–d) Optical sagittal MR sections showing the regeneration process in (b) sham operated controls, (c) cryo-injured, and (d) resected ventricles at 2, 7, 30, and 60 days post injury (dpi) in wt fish. The lesion is indicated with an arrow and the blood clot after resection is indicated with an arrow-head. The border between healthy and damaged heart tissue is indicated by zig-zag lines at 2 dpi. (e) Graph showing the cryoinjury volume in percentage of the ventricular volume at the 4 time points (see c) investigated for 13 individual fixed specimen [lesion size per ventricle (Y) and the mean value (bar line) at each post injury time point (X)] demonstrating the variability of the lesions between specimen. Anterior to the left, dorsal to the top. n/ time point = 2 per sham group and 4 per injury group. Scale bar 0.5 mm.