
Fig. S14
- ID
- ZDB-IMAGE-170619-16
- Publication
- Minchin et al., 2017 - A classification system for zebrafish adipose tissues
- All Figures
- Figures for Minchin et al., 2017
|
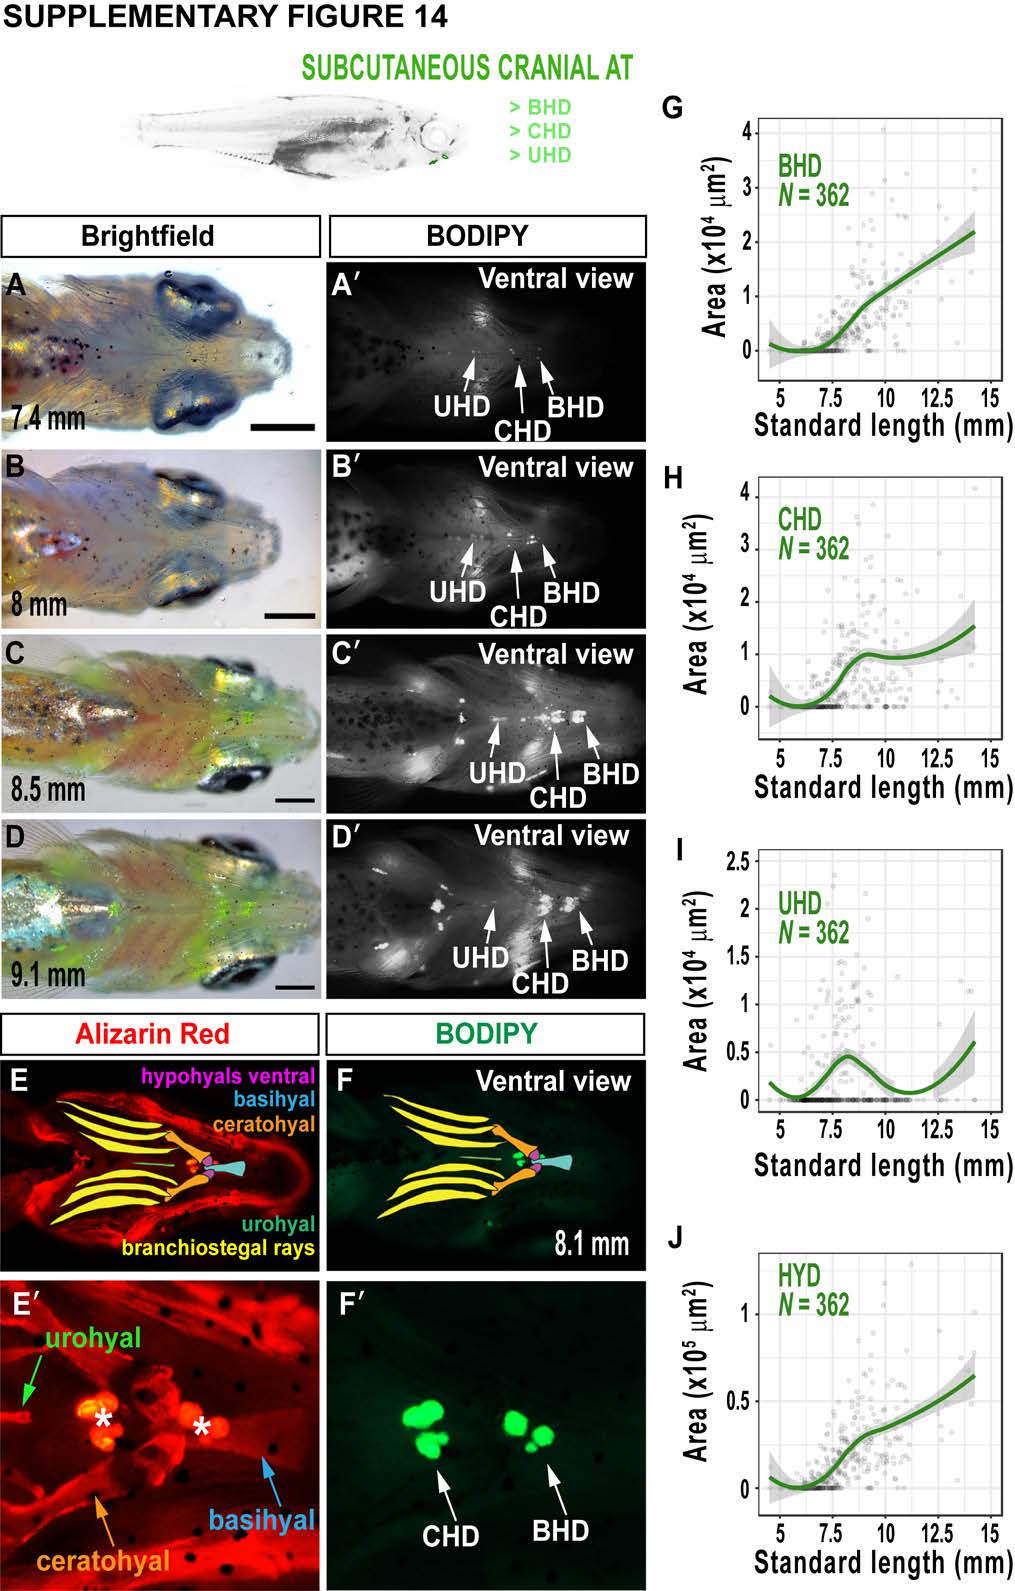
Fig. S14
Deposition and growth of AT in proximity to the hyoid apparatus (HYD). A-D. Brightfield images depicting morphological changes of the zebrafish jaw. A'-D'. Fluorescence images of BODIPY stained neutral lipid corresponding to the same fish shown in A-D. Note the 3 distinct AT clusters associated with cartilaginous elements of the jaw. E-F'. Alizarin Red staining of mineralized bone within the jaw (E,E'). The outline of these elements are traced and highlighted by colour in E. Asterisk indicates LD clusters. BODIPY staining of the same animal reveals LD clusters in close proximity to the basihyal and ceratohyal bones (F,F'). G-J. Relationship between SL and HYD ATs across the dataset. All views are from ventral. Scale bars are 1 mm (A-D). BHD = basihyoid AT, CHD = ceratohyoid AT, UHD = urohyoid AT. Fitted lines were generated by a LOESS function.