
IMAGE
Fig. S12
- ID
- ZDB-IMAGE-170619-14
- Publication
- Minchin et al., 2017 - A classification system for zebrafish adipose tissues
- All Figures
- Figures for Minchin et al., 2017
Image
|
Figure Caption
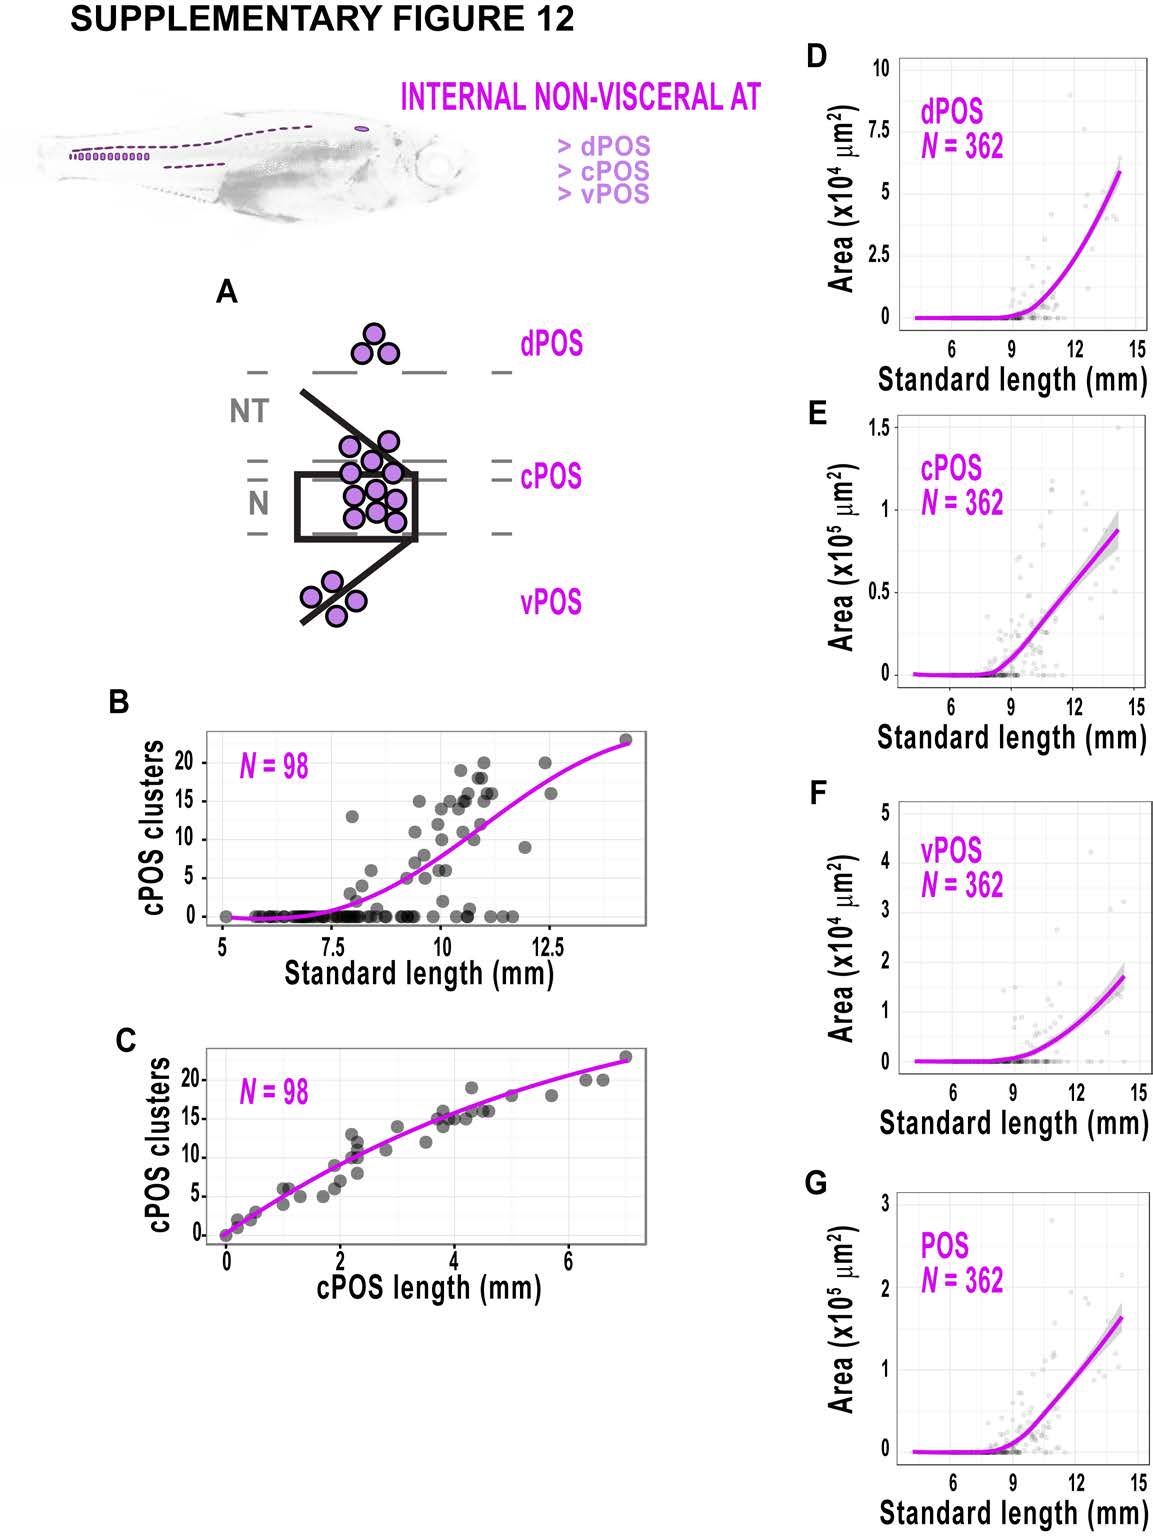
Fig. S12
Development of paraosseal NVAT (POS) in zebrafish. A. Schematic illustrating the location of POS. B. The number of cPOS clusters in relation to to SL. C. The number of cPOS clusters relative to the anterior-posterior length of cPOS. D-G. Relationship between SL and POS ATs across the dataset. Fitted lines were generated by a LOESS function.
Acknowledgments
This image is the copyrighted work of the attributed author or publisher, and
ZFIN has permission only to display this image to its users.
Additional permissions should be obtained from the applicable author or publisher of the image.
Full text @ Dis. Model. Mech.