
|
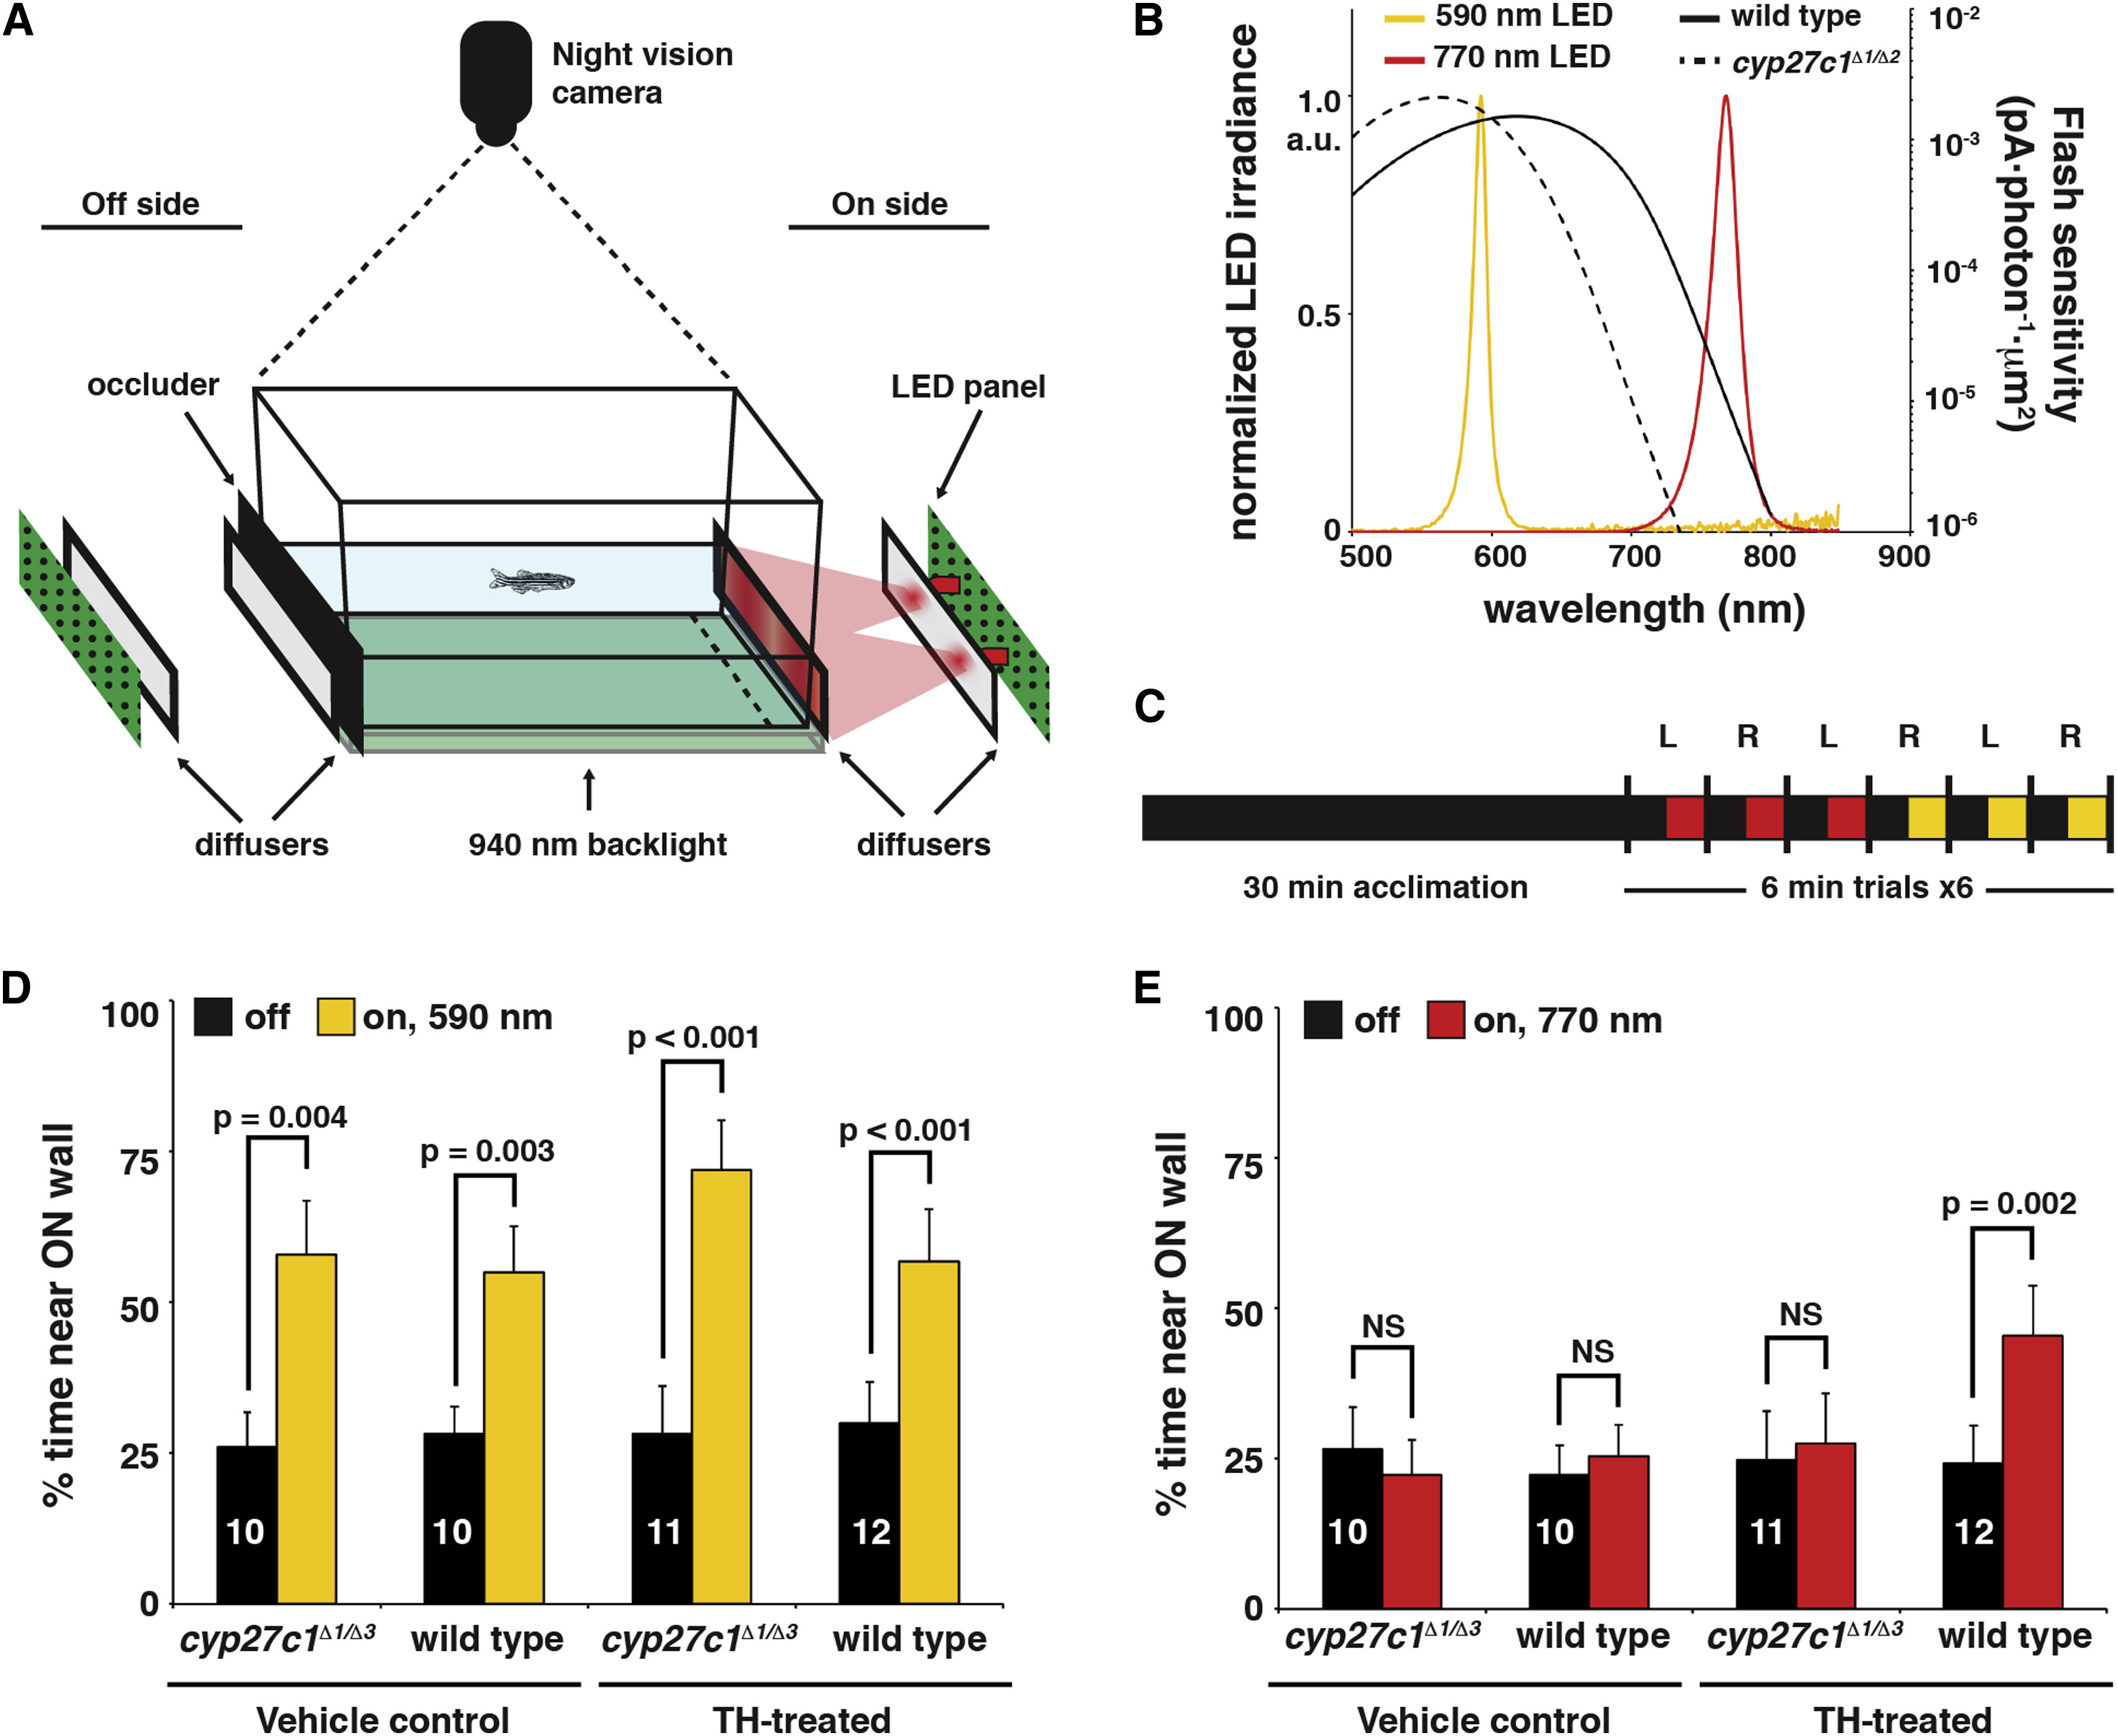
Fig. 5 Mutation of Cyp27c1 Abolishes the Phototactic Response to Near-Infrared Light
(A) The phototaxis assay consisted of 590- or 770-nm LED light sources placed on either the right or left side of a tank (depicted on the right side in the schematic). Light from the LEDs passed through two diffusers before illuminating one end of the tank. On the opposite end of the tank, a black occluder was inserted to prevent reflection off of the “off-side” diffuser. Fish movement was recorded using a night vision camera and a 940-nm infrared backlight located beneath the tank. The percentage of time spent within 25 mm of the lit “on” side (dashed line) was determined. The behavioral assay and subsequent data analysis were conducted in a blinded fashion with respect to the genotype of the fish.
(B) A comparison of red cone sensitivity data (reproduced from Figure 4D) and the measured LED spectra.
(C) Summary of the experimental design. Each dark-adapted fish was acclimated to the testing tank for 30 min in the dark and then recorded during a set of three trials each at 770 and 590 nm. Each trial consisted of 3 min dark and 3 min lit conditions, with the order of light/dark presentation randomized. The light source was alternated between the left and right sides for each trial.
(D) TH- and vehicle-treated cyp27c1Δ1/Δ3 mutants and wild-type siblings all showed a significant positive phototactic response to 590-nm light (paired Student’s t test; p < 0.005; n as indicated per group; error bars = SEM). All p values remained significant after Bonferroni correction for multiple testing.
(E) Only TH-treated wild-type fish showed a significant positive phototactic response to 770-nm light. For significantly different groups, p values are as shown. For vehicle-treated cyp27c1Δ1/Δ3 mutant and wild-type fish at 770 nm, p values were 0.449 and 0.177, respectively. For TH-treated cyp27c1Δ1/Δ3 mutants at 770 nm, the p value was 0.490 (paired t test; n as indicated per group; error bars = SEM). All p values remained significant after Bonferroni correction for multiple testing. See also Figure S4 and Movies S1 and S2.