
|
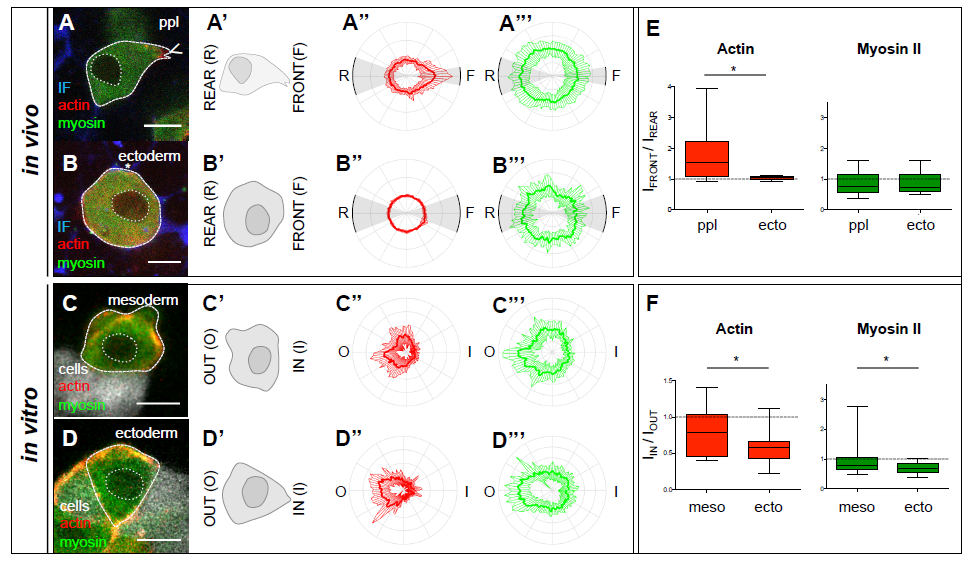
Fig. S2
Subcellular localization of actin and myosin II in ectoderm and mesoderm progenitors in vitro and in vivo.(A-D) Single confocal image plane of an exemplary Tg(βActin:myl12leGFP); Tg(βActin:Utrophin-mCherry) mesoderm (ppl) (A,C) and ectoderm (B,D) progenitor cell in vivo (A,B) with the surrounding IF labelled by Dextran-Cascade Blue® (blue), and in vitro (C,D) with adjacent cells labelled with Dextran- Alexa647 (white). Scale bars, 10 μm. (A'-D') Schematic illustration of the cells shown in (A-D) with their leading (front) and trailing edges (back) and cellmedium (out) and cell-cell (in) interfaces indicated. (A''-D'', A'''-D''') Normalized fluorescence intensity values on the periphery of mesoderm (ppl) (A'',A''',C'',C''') and ectoderm (B'',B''',D'',D''') cells from Tg(βActin:myl12leGFP); Tg(βActin:Utrophin-mCherry) embryos either in vitro (A'',A''',B'',B''') or within embryos at shield stage in vivo (6 hpf; C'',C''',D'',D''') shown as polar plots for actin (Utrophin-mCherry; A''-D'') and myosin II (myl12l-eGFP; A'''-D''') with the front and rear areas (in vivo) and ‘out' and ‘in' interfaces (in vitro) annotated. Standard deviation is indicated as perpendicular lines to the mean. n (ppl in vivo) = 21 cells (5 embryos), n (ectoderm in vivo) = 8 cells (5 embryos), n (mesoderm in vitro) = 18 cells (3 cell aggregates), n (ectoderm in vitro) =18 cells (3 cell aggregates). (E,F) Box-whisker plot of intensity ratios of actin (red) and myosin II (green), from the intensity profiles shown in (A''-D'', A'''-D'''), of the front versus the rear of ppl and ectoderm cells in vivo (E), and medium-facing outside and aggregate-facing inside of induced mesoderm and ectoderm progenitor cells on the surface of a heterotypical cell aggregate during cell sorting in vitro (F). Black line indicates the median value; whiskers show the spread of the data; dashed line indicates a value of 1 (equal intensity front versus rear); * p < 0.05.