
|
Fig. 6
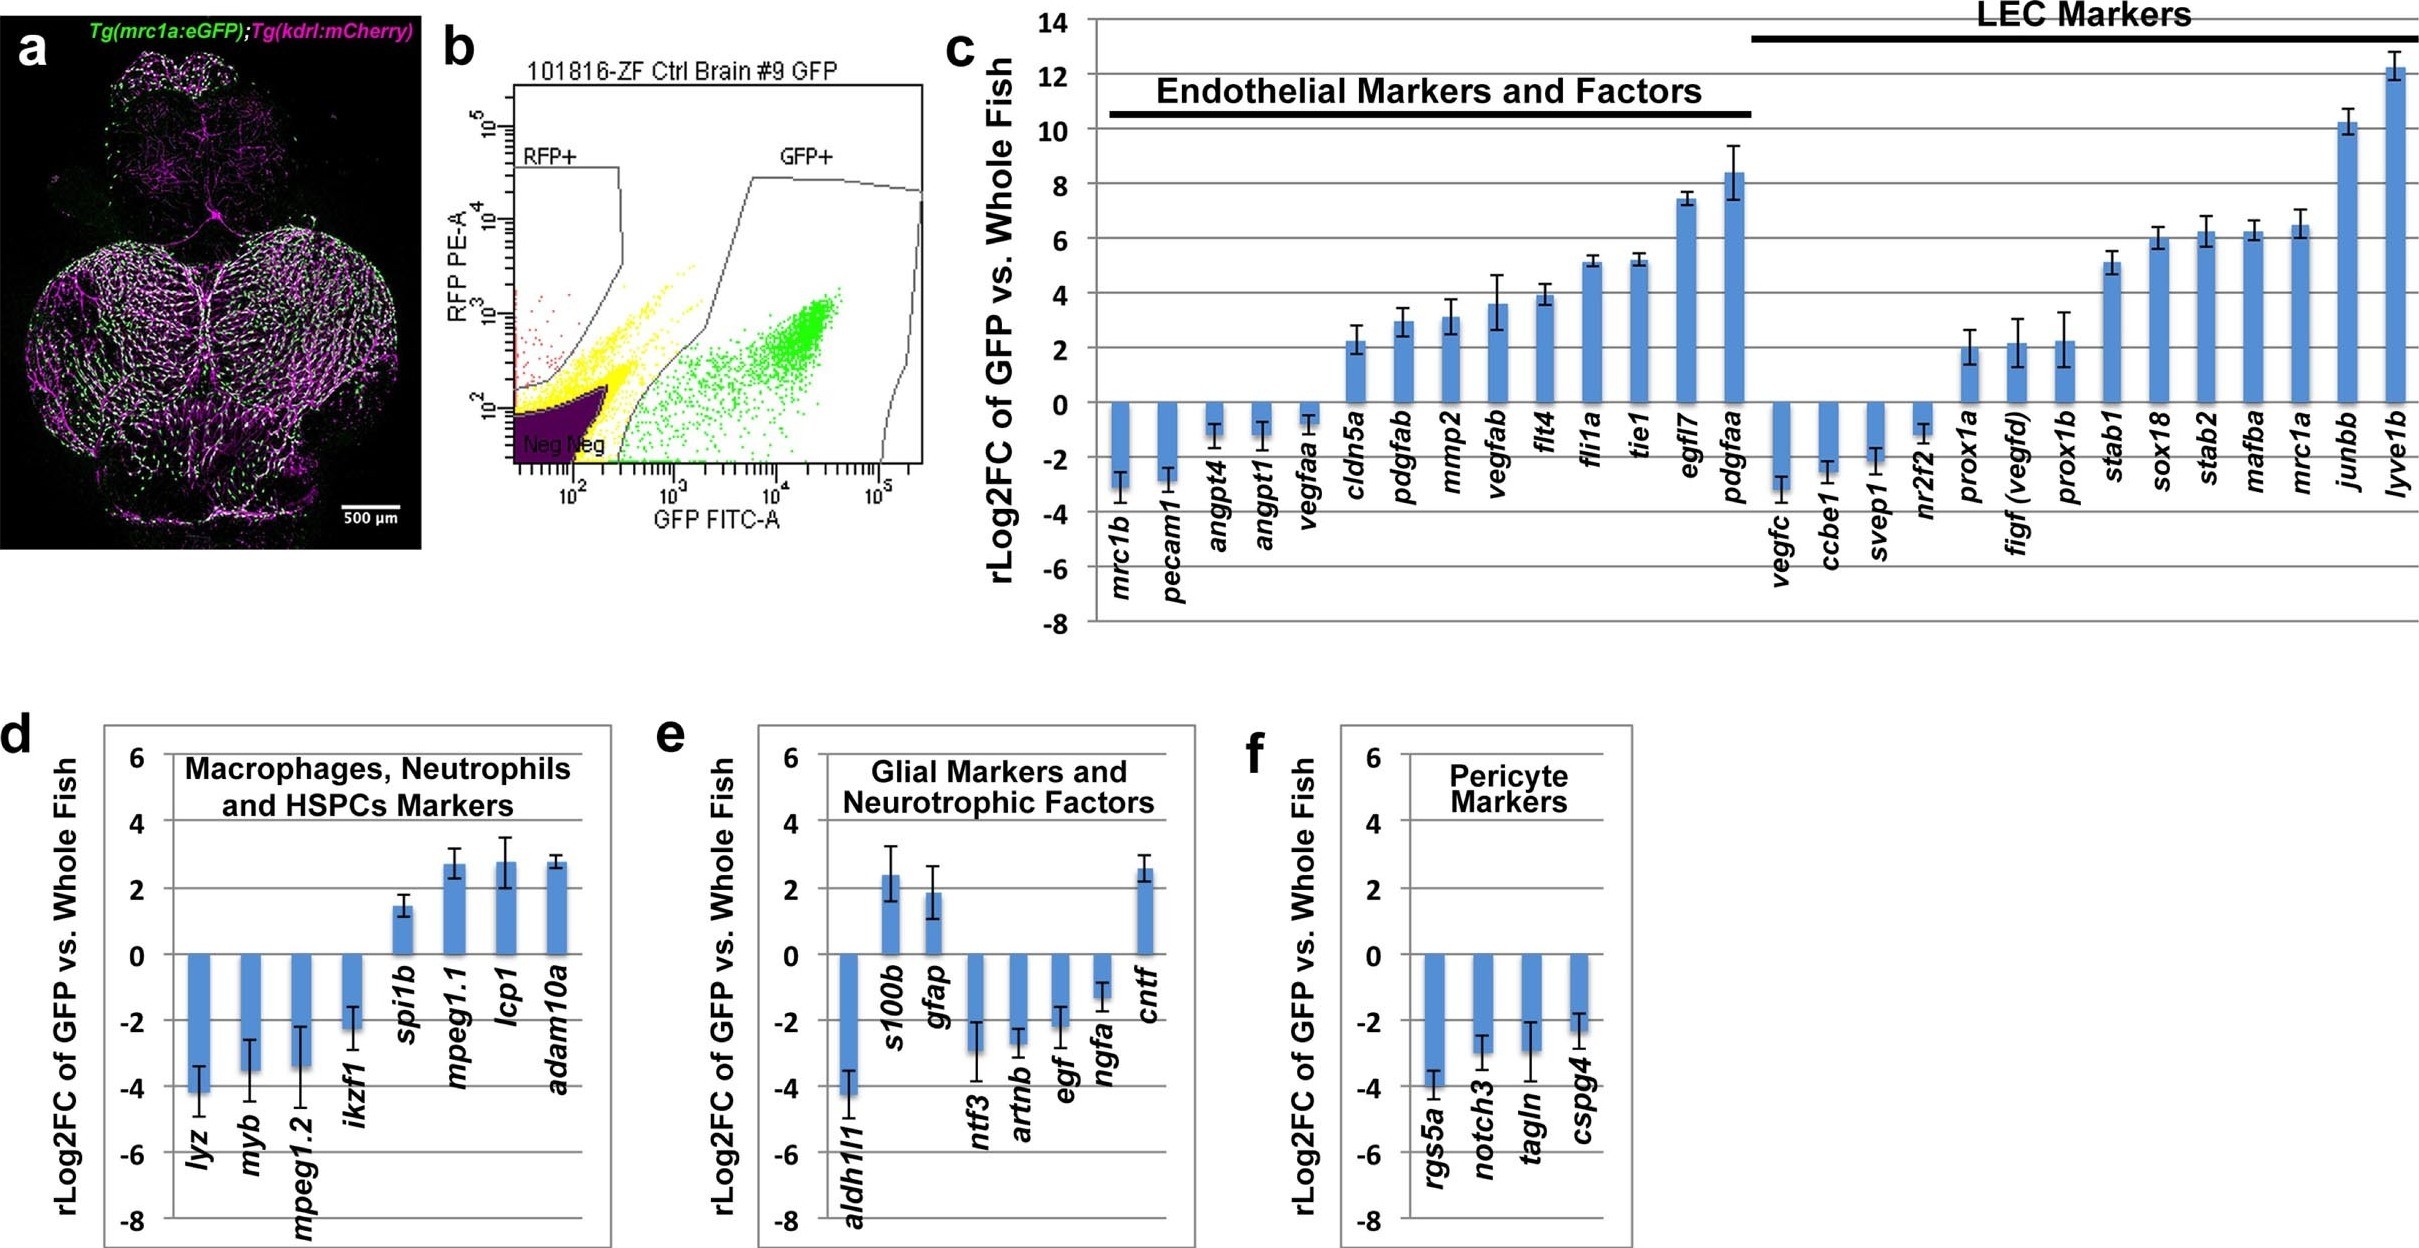
Global analysis of gene expression in FACS-sorted adult zebrafish FGPs.
(a) Confocal microscopic image of the optic lobes (top) and cerebellum of the dissected brain of a Tg(mrc1a:eGFP);Tg(kdrl:mCherry) double-transgenic adult zebrafish (EGFP and mCherry are shown in green and magenta, respectively), n = 10 adult brains. (b) FACS sorting of FGPs (GFP positive) and blood endothelial cells (RFP positive) from Tg(mrc1a:eGFP);Tg(kdrl:mCherry) adult tectal meninges; GFP vs. RFP (mCherry) plot showing gates used for cell collection. (c–f) Plots showing relative expression levels of selected genes in FACS sorted FGPs (EGFP-positive, n=~1000 cells per replicate from a total of ~8000 cells sorted) compared to whole fish. (c) Blood endothelial (left) and lymphatic endothelial (right) markers and factors; (d) macrophage, neutrophils and HSPC markers; e) glial and neurotrophic factors; (f) pericyte markers. Relative expression is plotted on a log two scale. Scale bars: 500 μm (a).