
Image
|
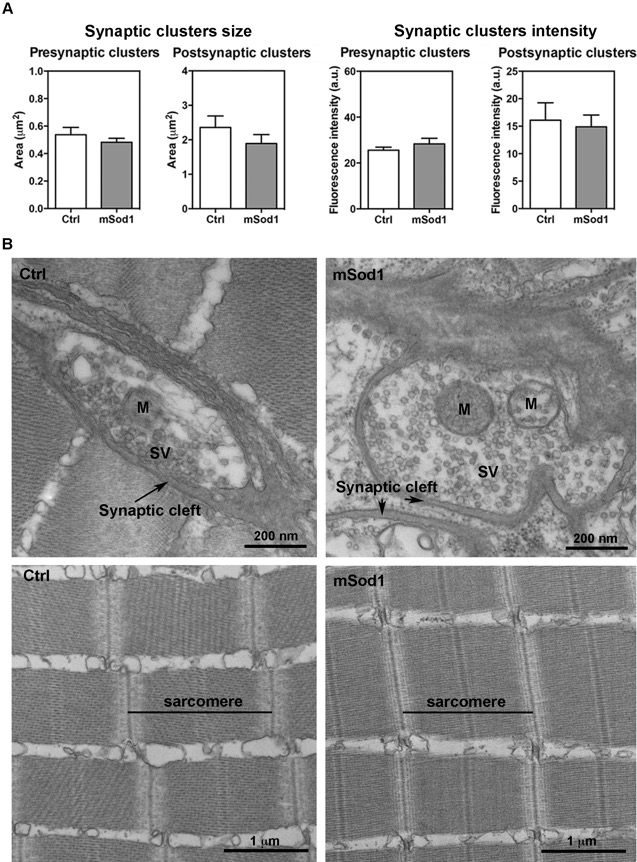
Figure Caption
Fig. S3
Twelve-month-old zebrafish neuromuscular junction (NMJ) and lateral white muscle structure.
(A) The 3D co-localization analyses of z-stacks covering the entire thickness of the lateral muscle sections of the mSod1 and control (Ctrl) fish did not reveal any significant differences in pre-synaptic (0.48 ± 0.03 μm2 vs 0.54 ± 0.05 μm2) or post-synaptic cluster size (1.89 ± 0.26 μm2 vs 2.36 ± 0.33 μm2), or in the fluorescence intensity of the pre-synaptic (28.34 ± 2.42 a.u. vs 25.56 ± 1.39 a.u.) or post-synaptic clusters (14.88 ± 2.16 a.u. vs 16.09 ± 3.16 a.u.). The columns indicate the mean values ± SEM of the indicated parameter in five Ctrl and six mSod1 adult zebrafish. The measures were statistically analysed using an unpaired Student t-test. (B) Representative electron microscopy images of the NMJ (upper panel) and muscle ultrastructure (lower panel) in Ctrl and mSod1 adults. M: mitochondria; SV: synaptic vesicles.
Acknowledgments
This image is the copyrighted work of the attributed author or publisher, and
ZFIN has permission only to display this image to its users.
Additional permissions should be obtained from the applicable author or publisher of the image.
Full text @ Sci. Rep.