
Fig. 4
- ID
- ZDB-IMAGE-170607-13
- Genes
- Antibodies
- Publication
- Benedetti et al., 2016 - INaP selective inhibition reverts precocious inter- and motorneurons hyperexcitability in the Sod1-G93R zebrafish ALS model
- All Figures
- Figures for Benedetti et al., 2016
|
Fig. 4
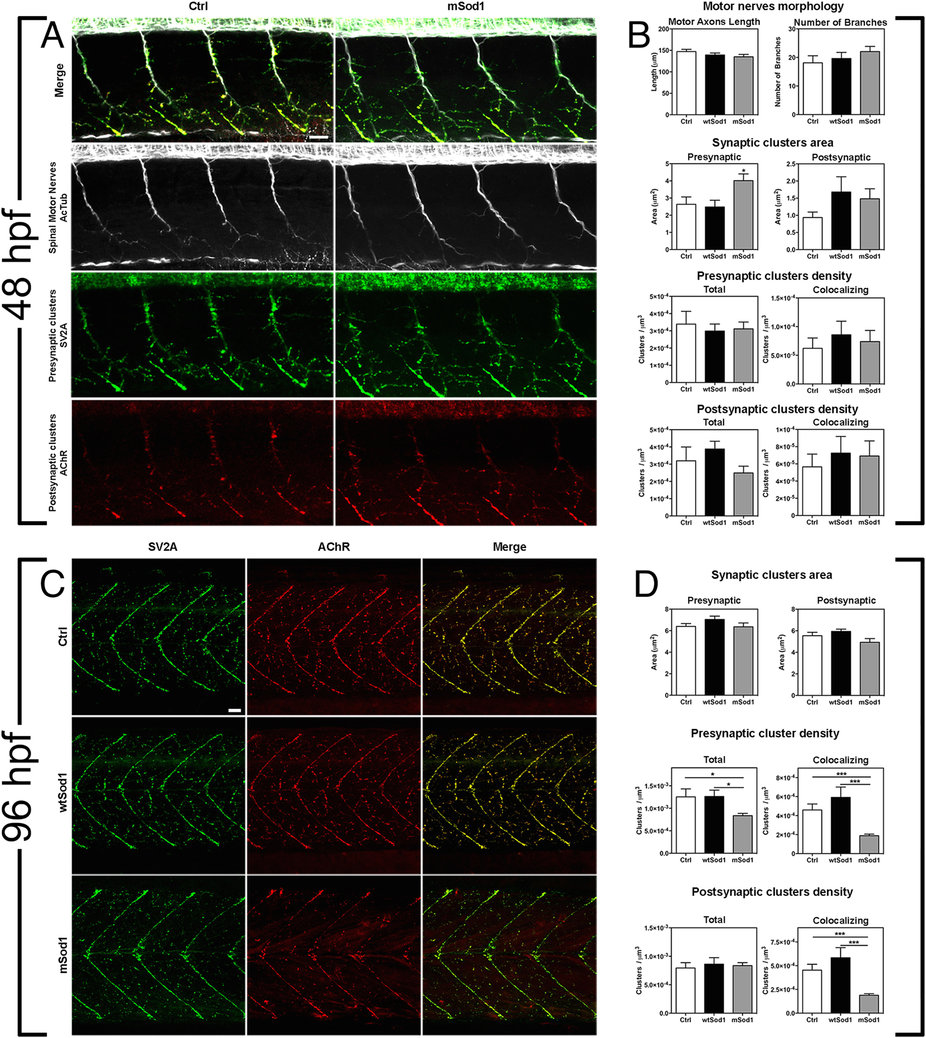
mSod1 embryos and larvae show defects in the clustering of synaptic vesicles and the maturation of neuromuscular junctions.
(A) Confocal analysis of the 9–13th somite trunk region at 48 hpf. Scale bar: 25 μm. (B) There were no differences among the control (Ctrl), wtSod1 and mSod1 embryos and larvae in terms of motor axon length (respectively 147.2 ± 5.2 μm, 139.3 ± 4.6 μm, and 135.1 ± 5.5 μm), the number of branches (18.1 ± 2.5, 19.7 ± 2.1, and 22.1 ± 1.8), or unbranched axon length (28.9 ± 4.8 μm, 6.6 ± 2.1 μm, and 7.9 ± 2.2 μm) (data not shown). The measurements were made in at least four motor nerves of a minimum of 10 embryos for each genotype. Three-dimensional (3D) object-based co-localization analysis (numerical data given in Table 1) did not reveal any differences in the densities of total pre-synaptic or pre-synaptic co-localizing clusters, or in the densities of total post-synaptic or post-synaptic co-localizing clusters, but there was a significant increase in the area of pre-synaptic (but not post-synaptic) clusters in the mSod1 embryos. (C) Confocal analysis of the 10–15th somite trunk region at 96 hpf. Scale bar: 25 μm. (D) Although the mean area of the pre- and post-synaptic clusters in the different genotypes remained unchanged, 3D object-based co-localisation analysis showed a significant reduction in the density of presynaptic (but not post-synaptic) SV2A clusters in mSod1 NMJs, and a significant reduction in co-localizing pre- and post-synaptic clusters in mSod1 larvae (numerical data given in Table 1).