
IMAGE
Fig. 5
- ID
- ZDB-IMAGE-170606-23
- Antibodies
- Publication
- Naylor et al., 2017 - Wnt8a expands the pool of embryonic kidney progenitors in zebrafish
- All Figures
- Figures for Naylor et al., 2017
Image
|
Figure Caption
Fig. 5
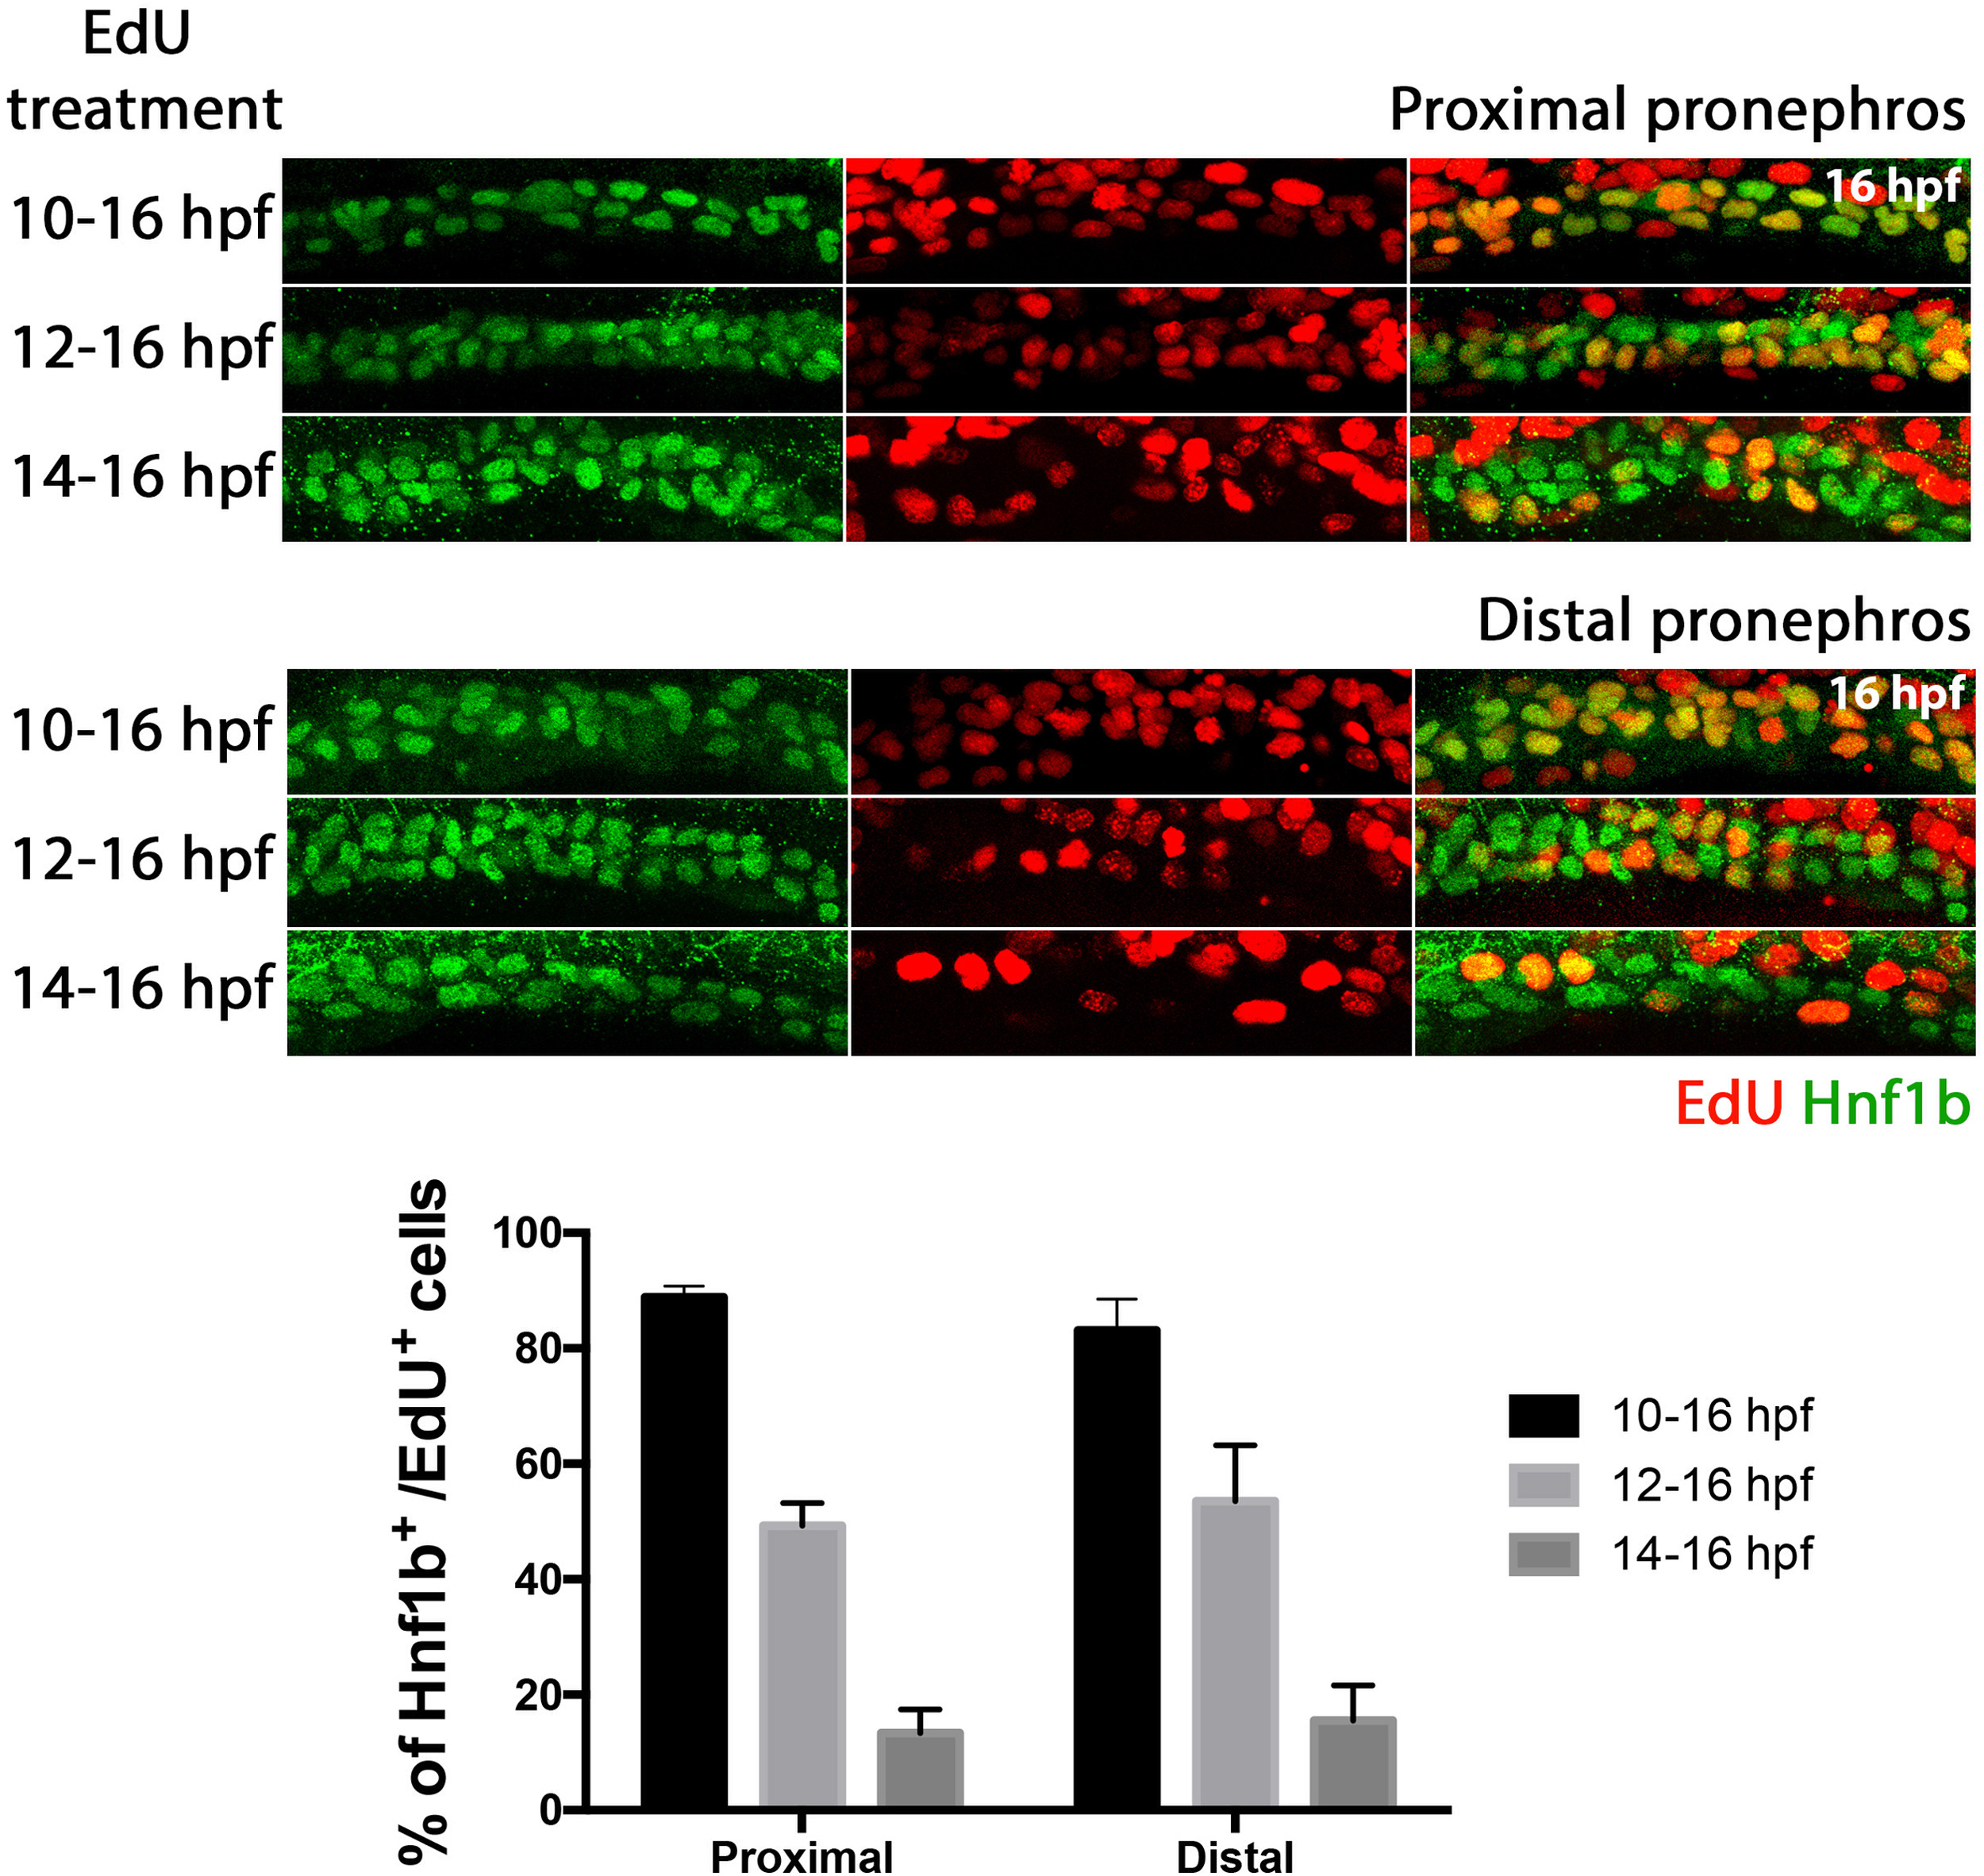
Characterisation of renal cell proliferation between 10 and 16 hpf. The top nine panels show Hnf1b/ EdU staining in the proximal pronephros. The bottom nine panels show Hnf1b/ EdU staining in the distal pronephros. The varying lengths of EdU treatment are indicated to the left of each panel. Hnf1b staining is shown in the left panels, middle panels show EdU staining and right panels show merged images of Hnf1b/EdU staining. Histogram shows the percentage of Hnf1b+ cells that were also EdU+ for each EdU treatment window.
Figure Data
Acknowledgments
This image is the copyrighted work of the attributed author or publisher, and
ZFIN has permission only to display this image to its users.
Additional permissions should be obtained from the applicable author or publisher of the image.
Reprinted from Developmental Biology, 425(2), Naylor, R.W., Han, H.I., Hukriede, N.A., Davidson, A.J., Wnt8a expands the pool of embryonic kidney progenitors in zebrafish, 130-141, Copyright (2017) with permission from Elsevier. Full text @ Dev. Biol.