
|
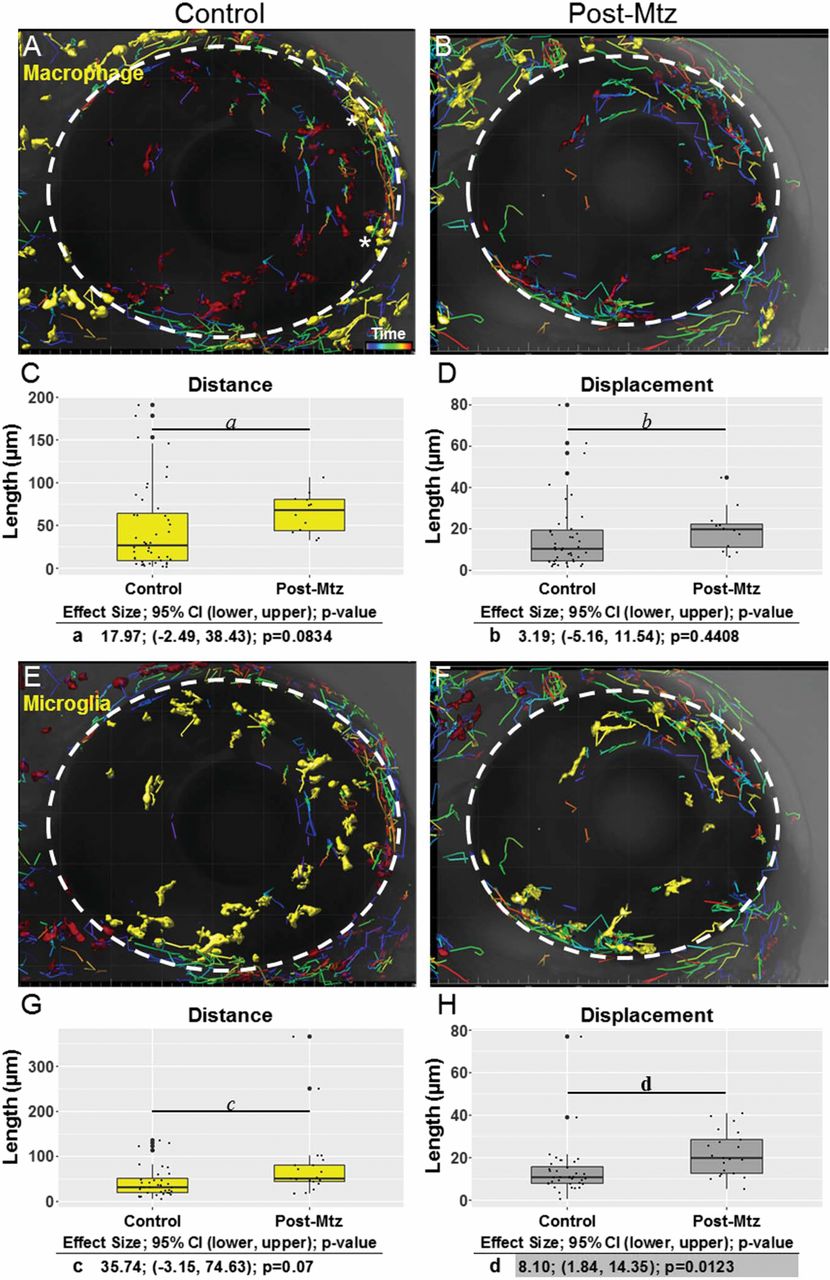
Fig. S2
Macrophage/microglia migration postablation during the recovery phase. Confocal time-lapse microscopy was used to characterize cell migration after Mtz-induced ablation of rod photoreceptor cells in the retina. (A and B) The macrophages selected for tracking are highlighted (yellow) in control (A) and ablated (B) retinas. (C and D) Boxplots representing migration path distance (yellow, C) and displacement (gray, D) of macrophages over 20 h in control (untreated) fish and after Mtz-induced ablation. (E and F) Microglia selected for tracking are highlighted (yellow) in control (E) and ablated (F) retinas. (G and H) Boxplots representing migration path distance (yellow, G) and displacement (gray, H) over 20 h of microglia in both control (untreated) retinas and in retinas with Mtz-induced ablation. The macrophages marked by asterisks in A are subconjunctival, exterior to the RPE. The eye boundary is indicated by the dashed circle in A, B, E, and F (34× magnification). In C, D, G, and H, outliers are represented by large black dots centered on the y axis. For statistical comparisons, see the tables below the respective graphs.