
Image
|
Figure Caption
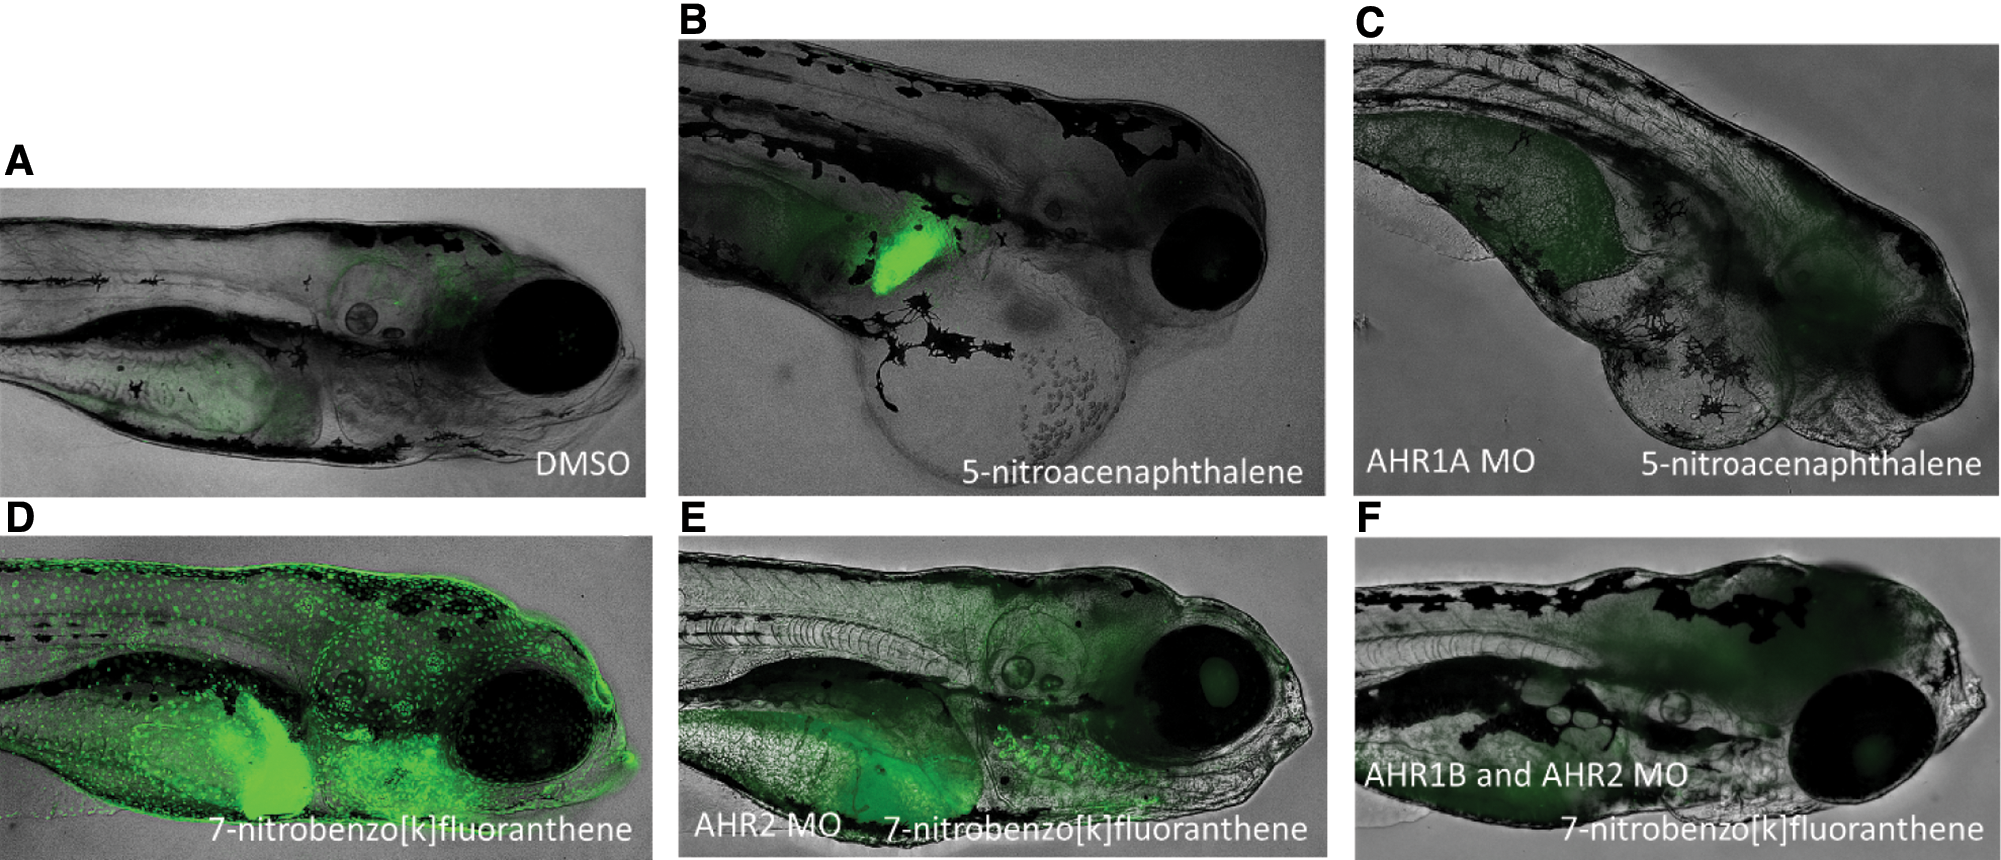
Fig. 3
Selected representative images of cyp1a/GPF expression in Tg(cyp1a:nls-egfp) transgenic zebrafish following chemical exposures and morpholino oligonucleotide injections. Examples of cyp1a/GFP expression patterns in the DMSO-exposed animals (A), liver (B), absence liver expression in AHR1A morphants (C), skin, neuromasts and liver (D), near-complete elimination of skin, neuromast, and vascular expression in AHR2 morphants (E), and complete skin, neuromast, and vasculature expression elimination (F) following co-injection of the AHR2 and AHR1B morpholinos, following exposure to indicated NPAHs.
Acknowledgments
This image is the copyrighted work of the attributed author or publisher, and
ZFIN has permission only to display this image to its users.
Additional permissions should be obtained from the applicable author or publisher of the image.
Full text @ Toxicol. Sci.