
Fig. 7
- ID
- ZDB-IMAGE-170602-31
- Publication
- Drerup et al., 2017 - Regulation of mitochondria-dynactin interaction and mitochondrial retrograde transport in axons
- All Figures
- Figures for Drerup et al., 2017
|
Fig. 7
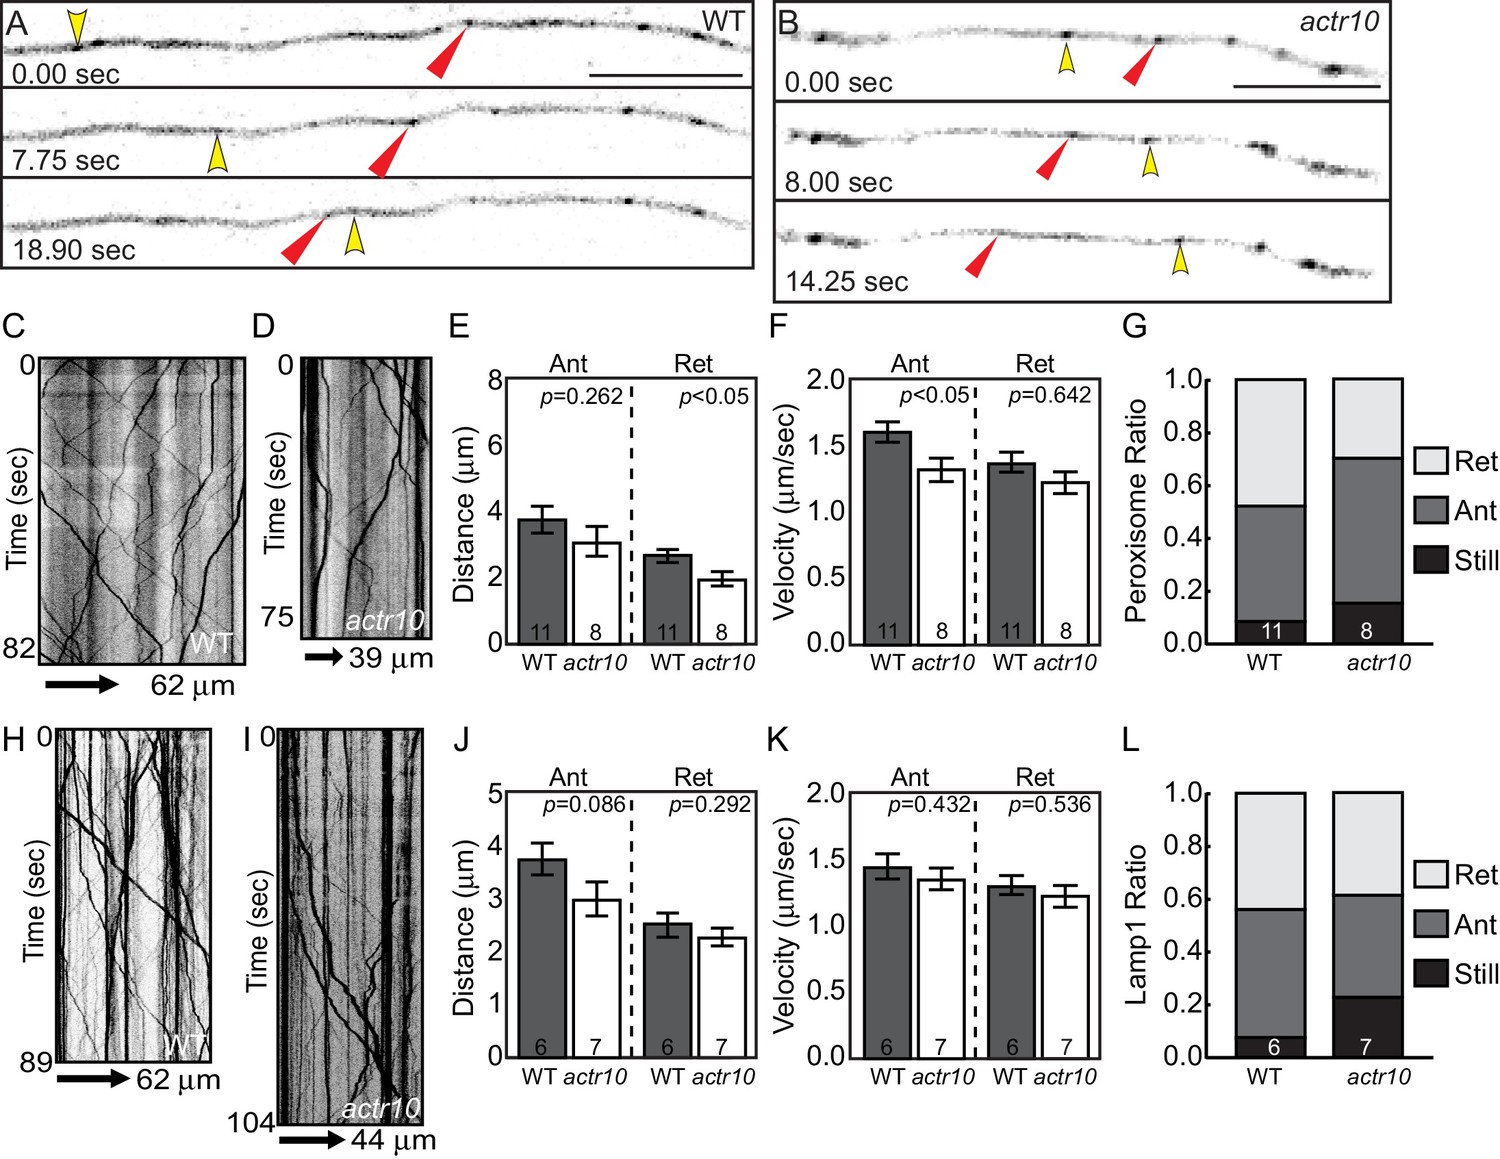
Peroxisome and Lamp1 vesicle transport in actr10 mutants at 4 dpf.
(A,B) Stills from peroxisome imaging sessions at 4 dpf from Videos 5 and 6. Yellow and red arrowheads point to anterograde and retrograde peroxisome movement respectively. (C,D) Kymographs analyses of peroxisome transport in wildtype (C) and actr10 mutants (D). (E–G) Peroxisome transport parameters were similar between actr10 mutants and wildtype siblings, though a slight reduction in retrograde distance and anterograde velocity were noted (ANOVA; mean ± SEM shown). The proportion of peroxisomes moving in the retrograde direction was reduced as well, though not significantly (ANOVA; mean ± SEM shown; p=0.07). (H,I) Kymographs of Lamp1-labeled vesicle movement at 4dpf. (J–L) Lamp1 vesicles were transported similarly between wildtype and actr10 mutants. An increase in the proportion of these vesicles in mutants that were stationary during imaging was noted (p<0.01; ANOVA; mean ± SEM shown). Number of larvae assayed is indicated on graphs. Scale bars = 10 µm.