
|
Fig. 3
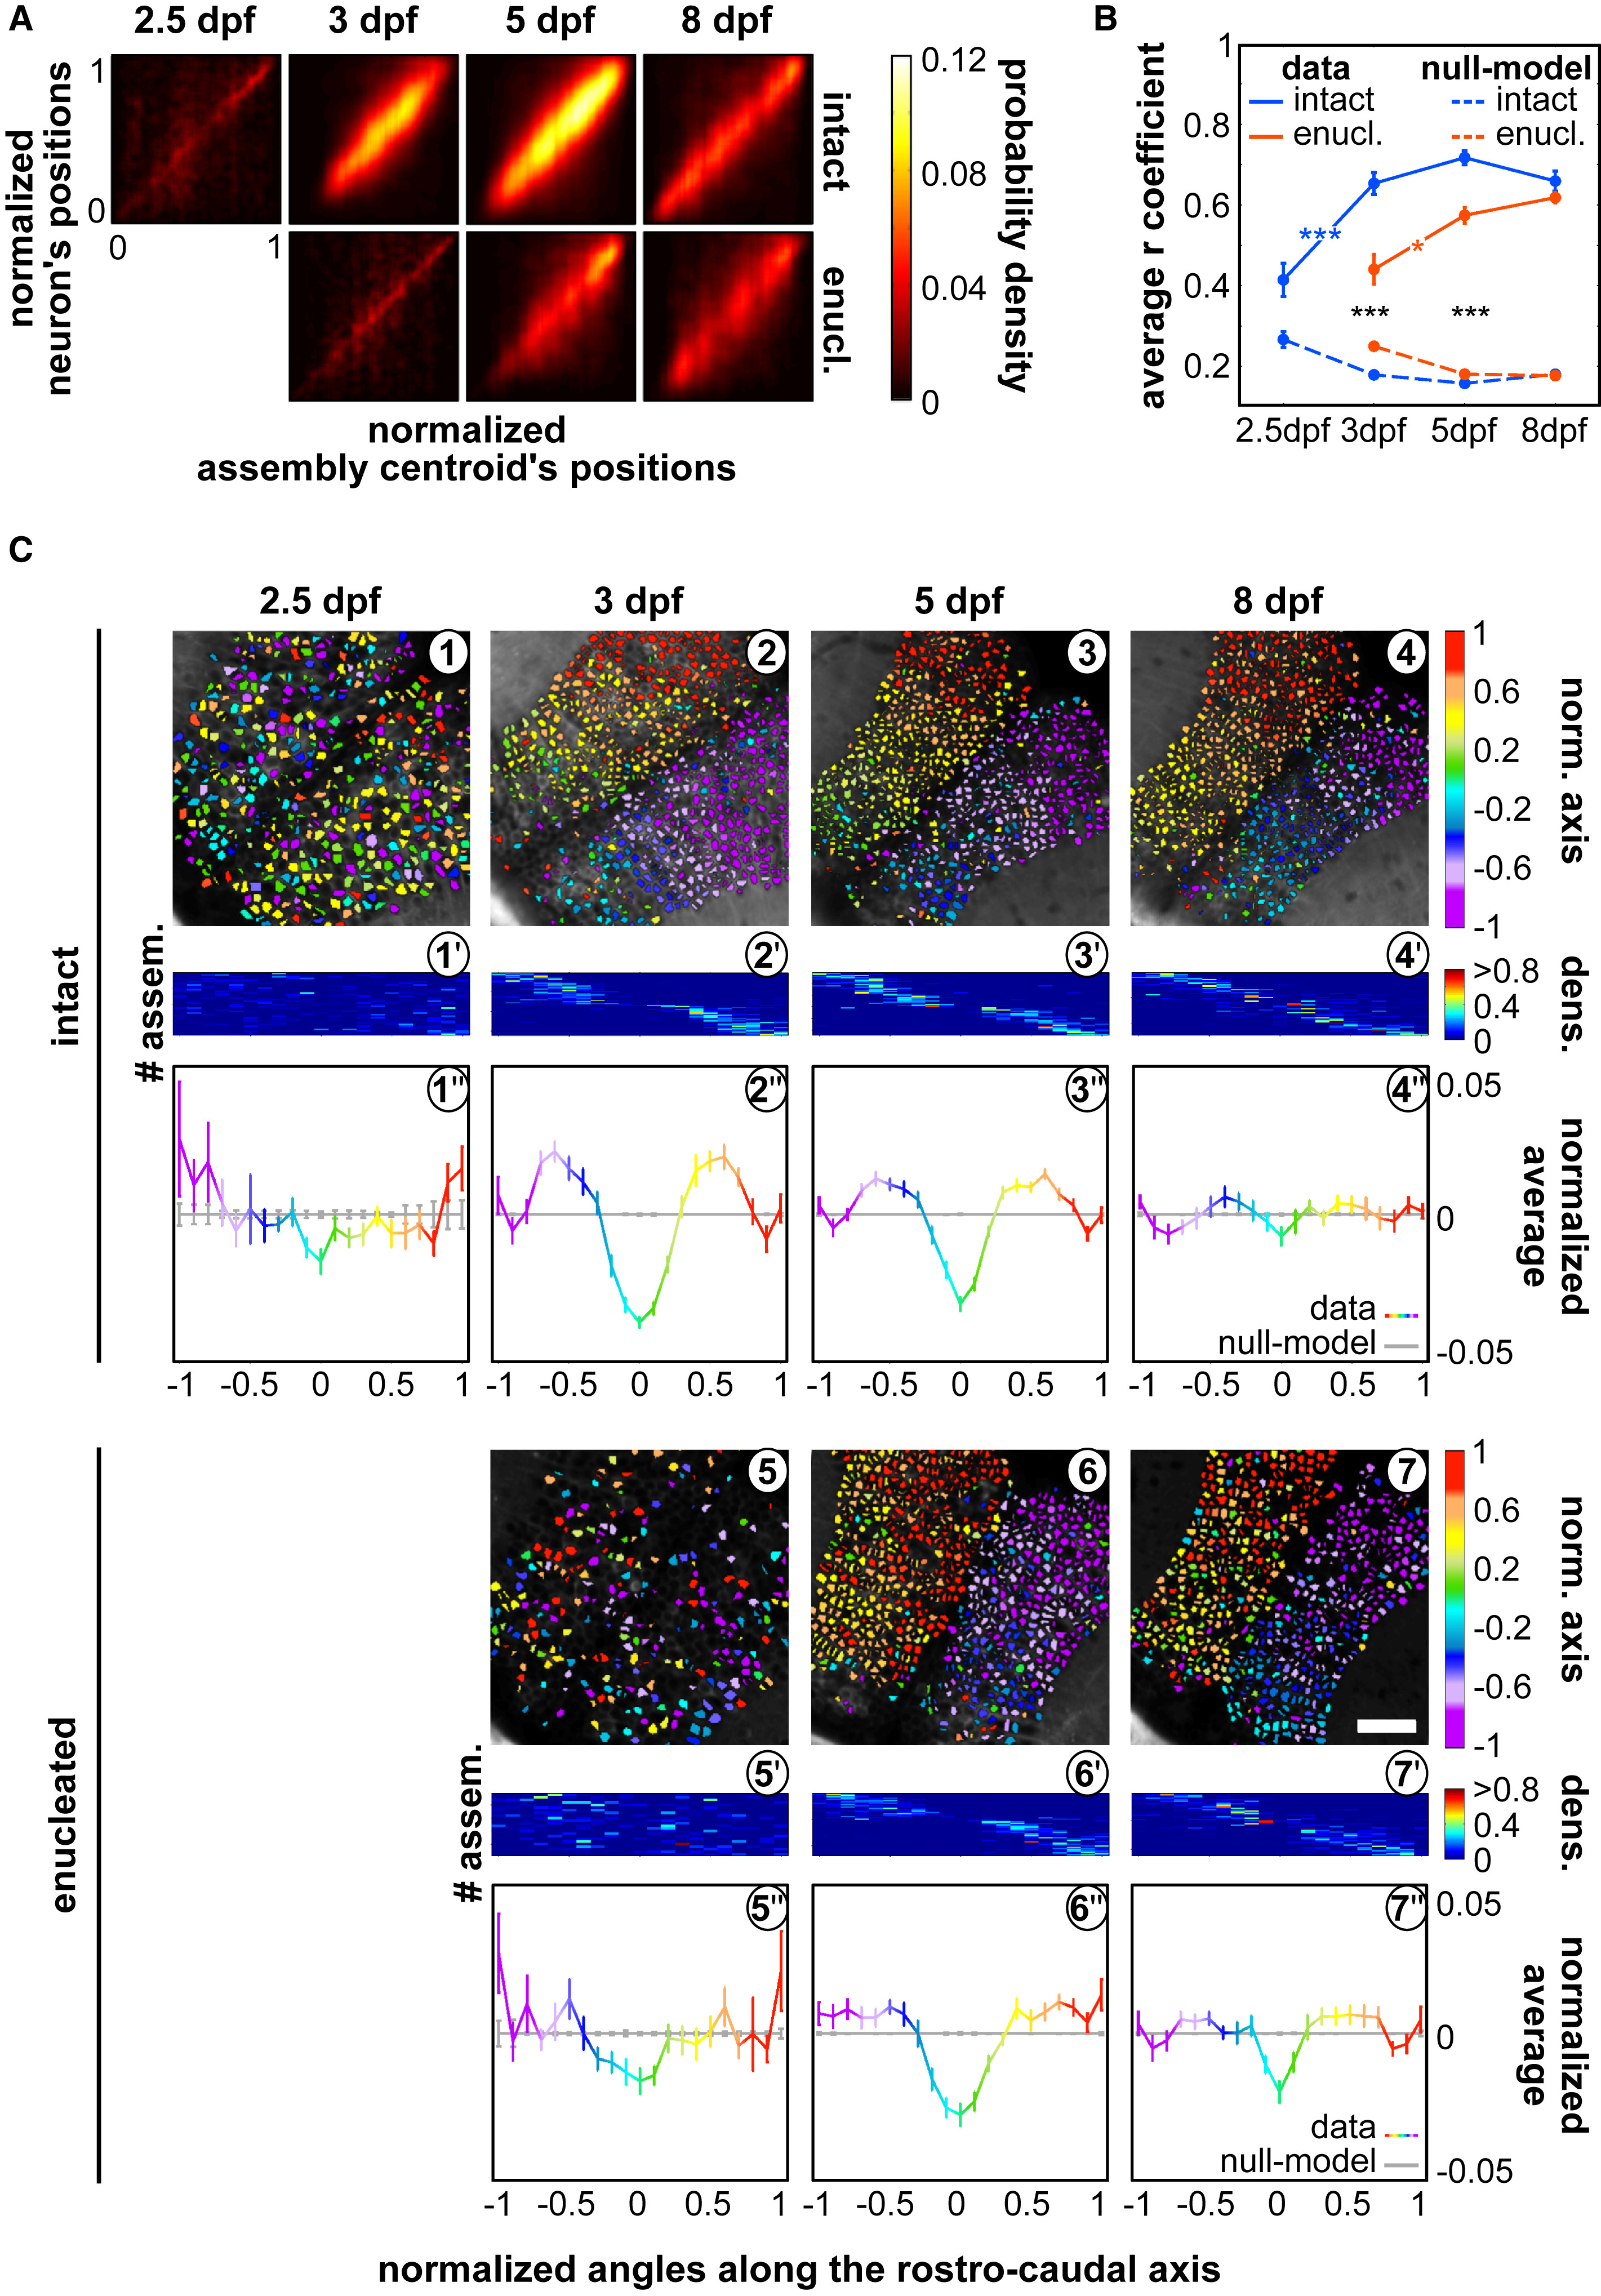
The Spontaneous Neuronal Assemblies Progressively Organize along the Tectal Caudo-rostral Axis, during Development
(A) Density plots of the caudo-rostral normalized positions of each neuron against the normalized position of each neuronal assembly centroid along the caudo-rostral axis of the tectum, in intact and enucleated (enucl.) larvae, at each developmental stage; 0 is the most rostral position and 1 is the most caudal one (in the enucleated 8-dpf larva density plot; the respective null models are in Figure S4C).
(B) Average r coefficients of the regression fit between the position of the assembly’s centroids and that of the assembly’s neurons, along the caudo-rostral axis, in intact (blue) and enucleated (enucl.; red) larvae. The respective null models are depicted by the dashed curves in the right panel. ∗∗∗p < 0.001.
(C) Topographic organization of the spontaneous neuronal assemblies. (1–4) Examples of assemblies’ topographies projected along the caudo-rostral axis of an intact larva at different developmental stages. Color bar: position along the caudo-rostral axis (the neurons are color coded according to the centroid azimuthal position of the assembly to which they belong). (5–7) Same as for (1)–(4), but for the enucleated larvae. Scale bar represents 100 μm. (1'–7') Distribution of the density of number of neurons belonging to each assembly, along the normalized (norm.) caudo-rostral axis, for the experiment illustrated in (1)–(7), respectively; y axis: neuronal assembly number (# assem.); x axis: normalized caudo-rostral tectal axis (see Figure S4D for the distributions of all experiments and their respective null models). Color bar: neuronal density along the normalized caudo-rostral axis (dens.). (1''–7'') Average normalized mean distributions of the assemblies’ neuronal densities in (1')–(7'), for all experiments during the different developmental stages, in intact and enucleated conditions, color coded accordingly to their normalized azimuthal positions (color bar). The normalized mean distributions of the respective null models are depicted in gray.
Error bars indicate SEM. See also Figure S4.