
|
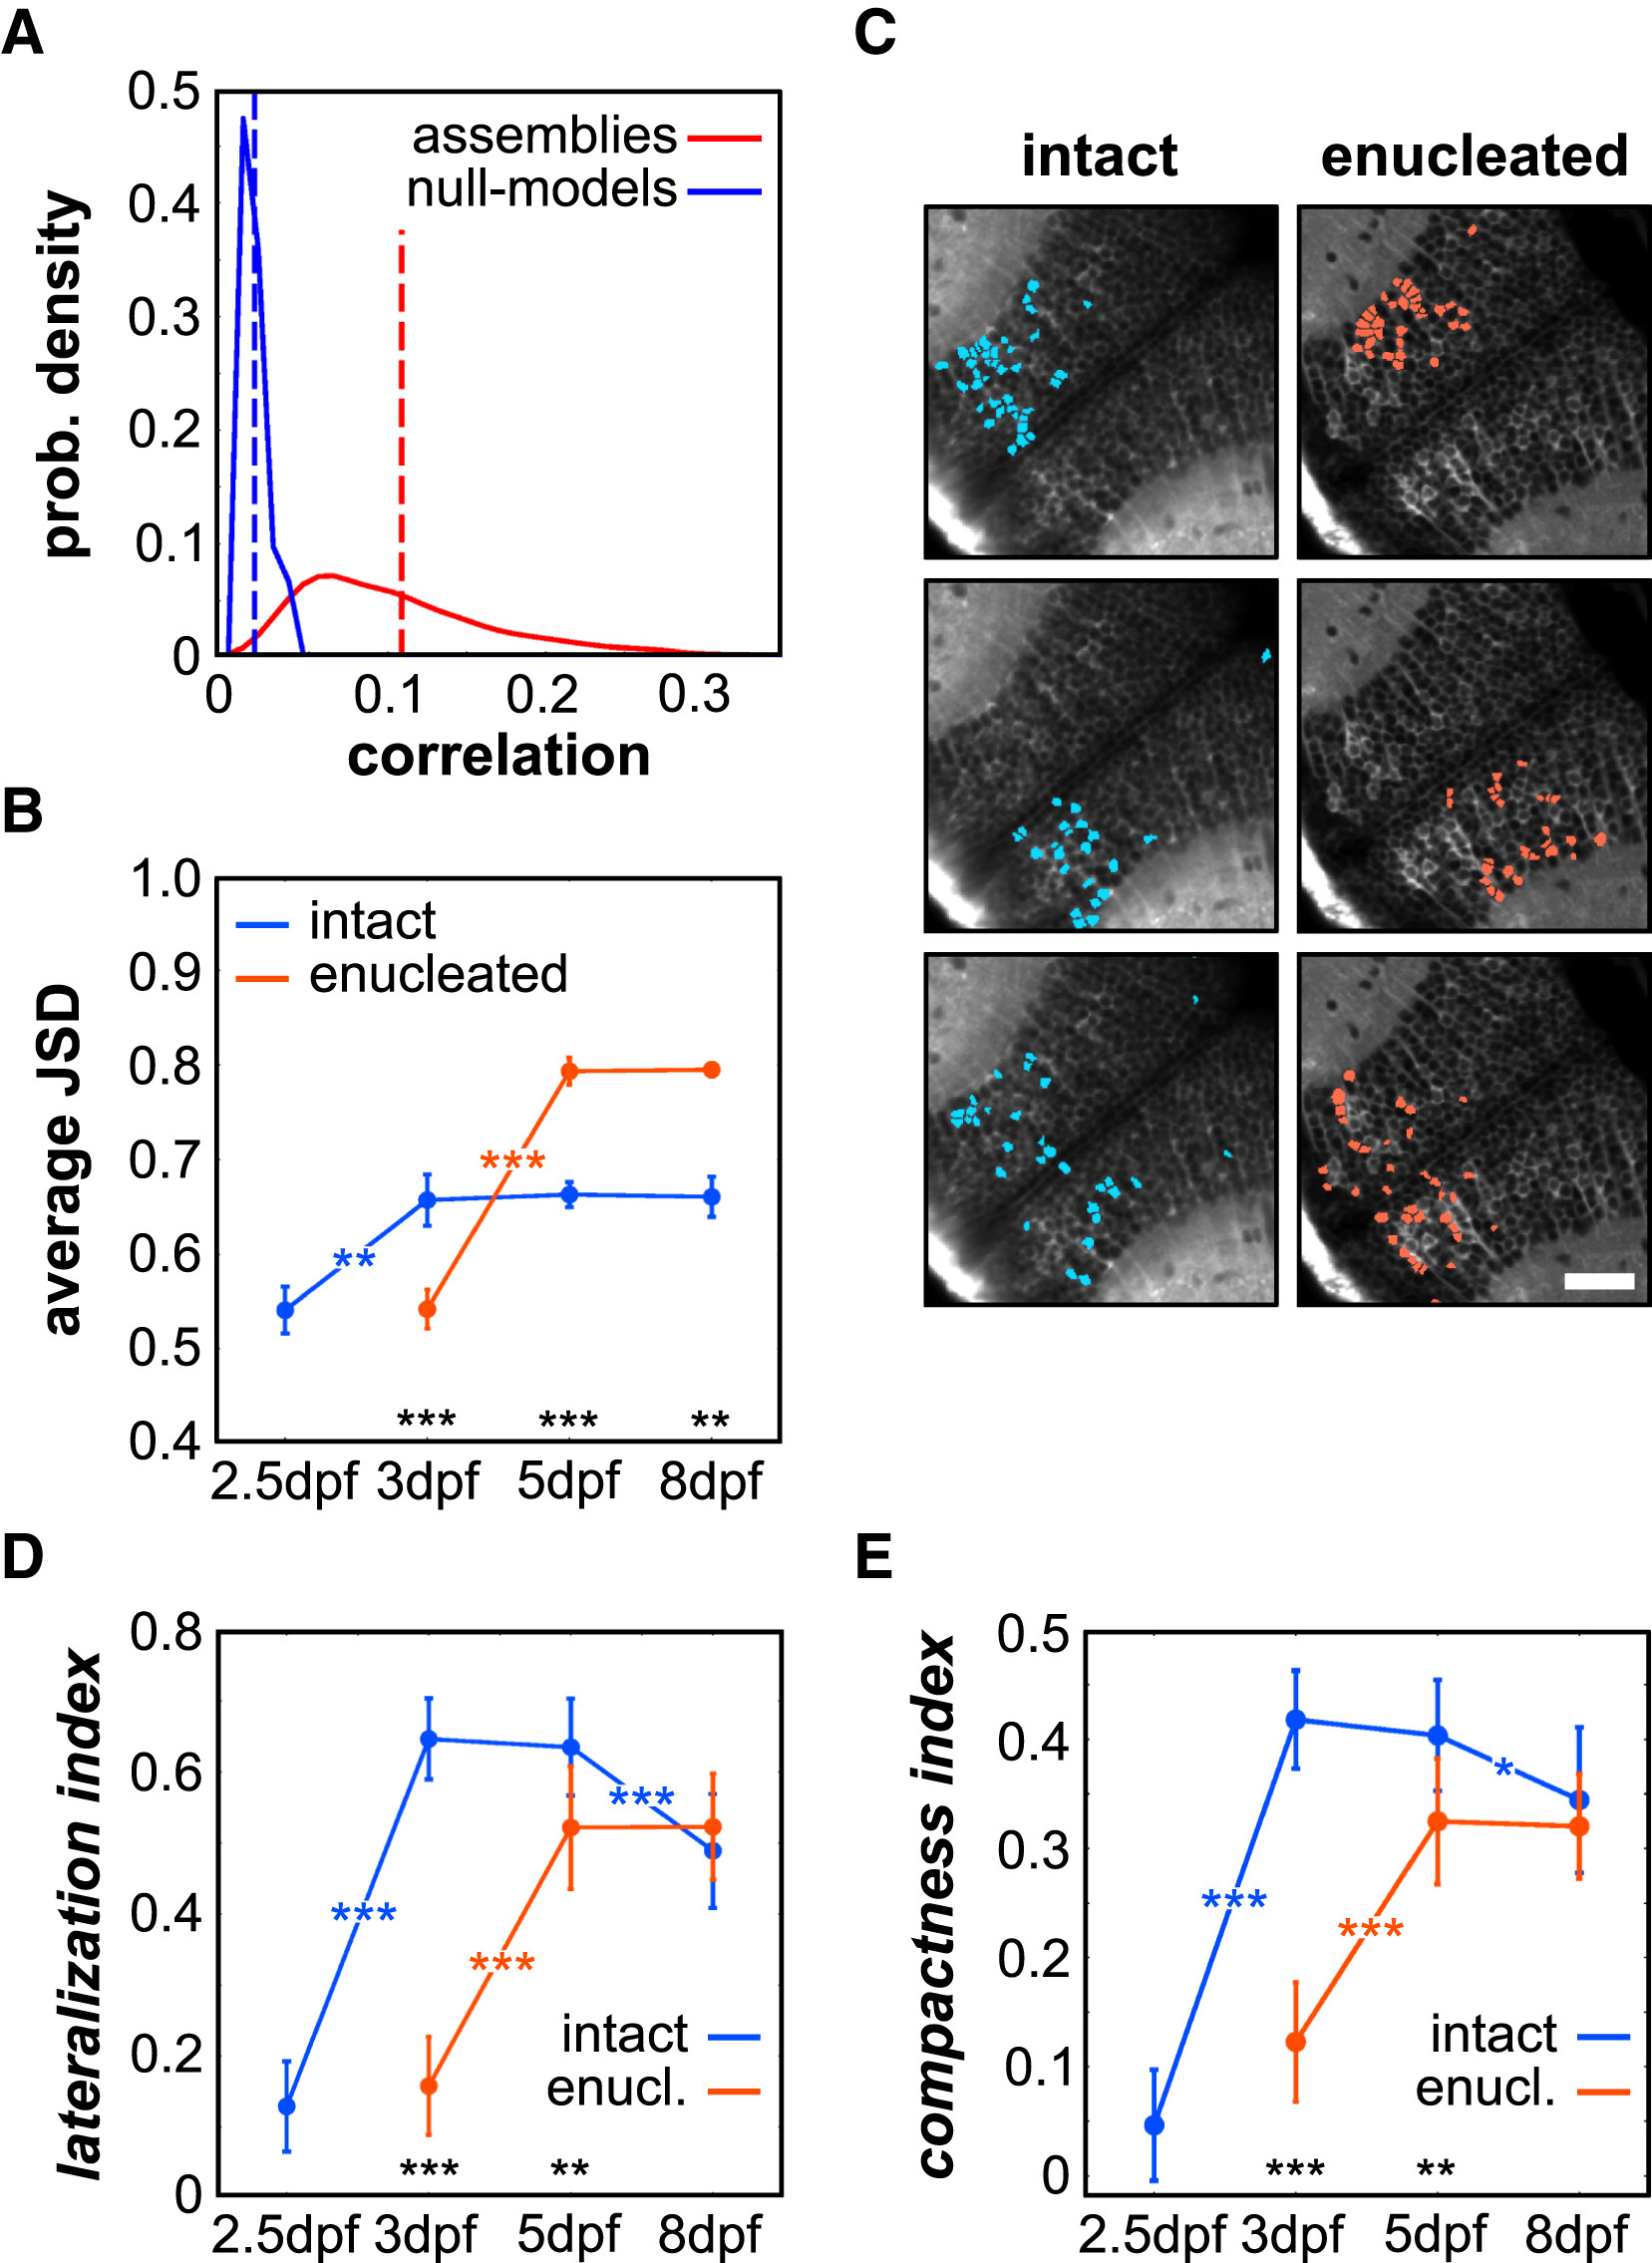
Fig. 2
The Tectal Spontaneous Activity Structure Is Organized in Functional Neuronal Assemblies
(A) Probability (prob.) density of the distributions of the average correlations between neurons within each assembly and the corresponding null model, in intact larvae 5 dpf. The dotted lines represent the average correlation, in red for the data (0.108 ± 0.010) and blue for the null models (0.016 ± 0.002).
(B) Average JSD for the spontaneous neuronal assemblies across the different developmental stages, in intact and enucleated conditions.
(C) Topographies of representative neuronal assemblies emerging from the spontaneous activity of a 5 dpf intact and enucleated larva. Scale bar, 100 μm.
(D and E) Average index of lateralization, depicting the position of neurons within an assembly across both tecta (D), and index of compactness, representing the dispersion of neurons within a given assembly (E), for the neuronal assemblies during development, in intact and enucleated (enucl.) larvae.
Blue indicates intact larvae, and red indicates enucleated larvae in (B), (D), and (E).
∗: p < 0.05; ∗∗: p < 0.01; ∗∗∗: p < 0.001. Error bars indicate SEM.