
Fig. S8
- ID
- ZDB-IMAGE-170526-15
- Publication
- Muto et al., 2017 - Activation of the hypothalamic feeding centre upon visual prey detection
- All Figures
- Figures for Muto et al., 2017
|
Fig. S8
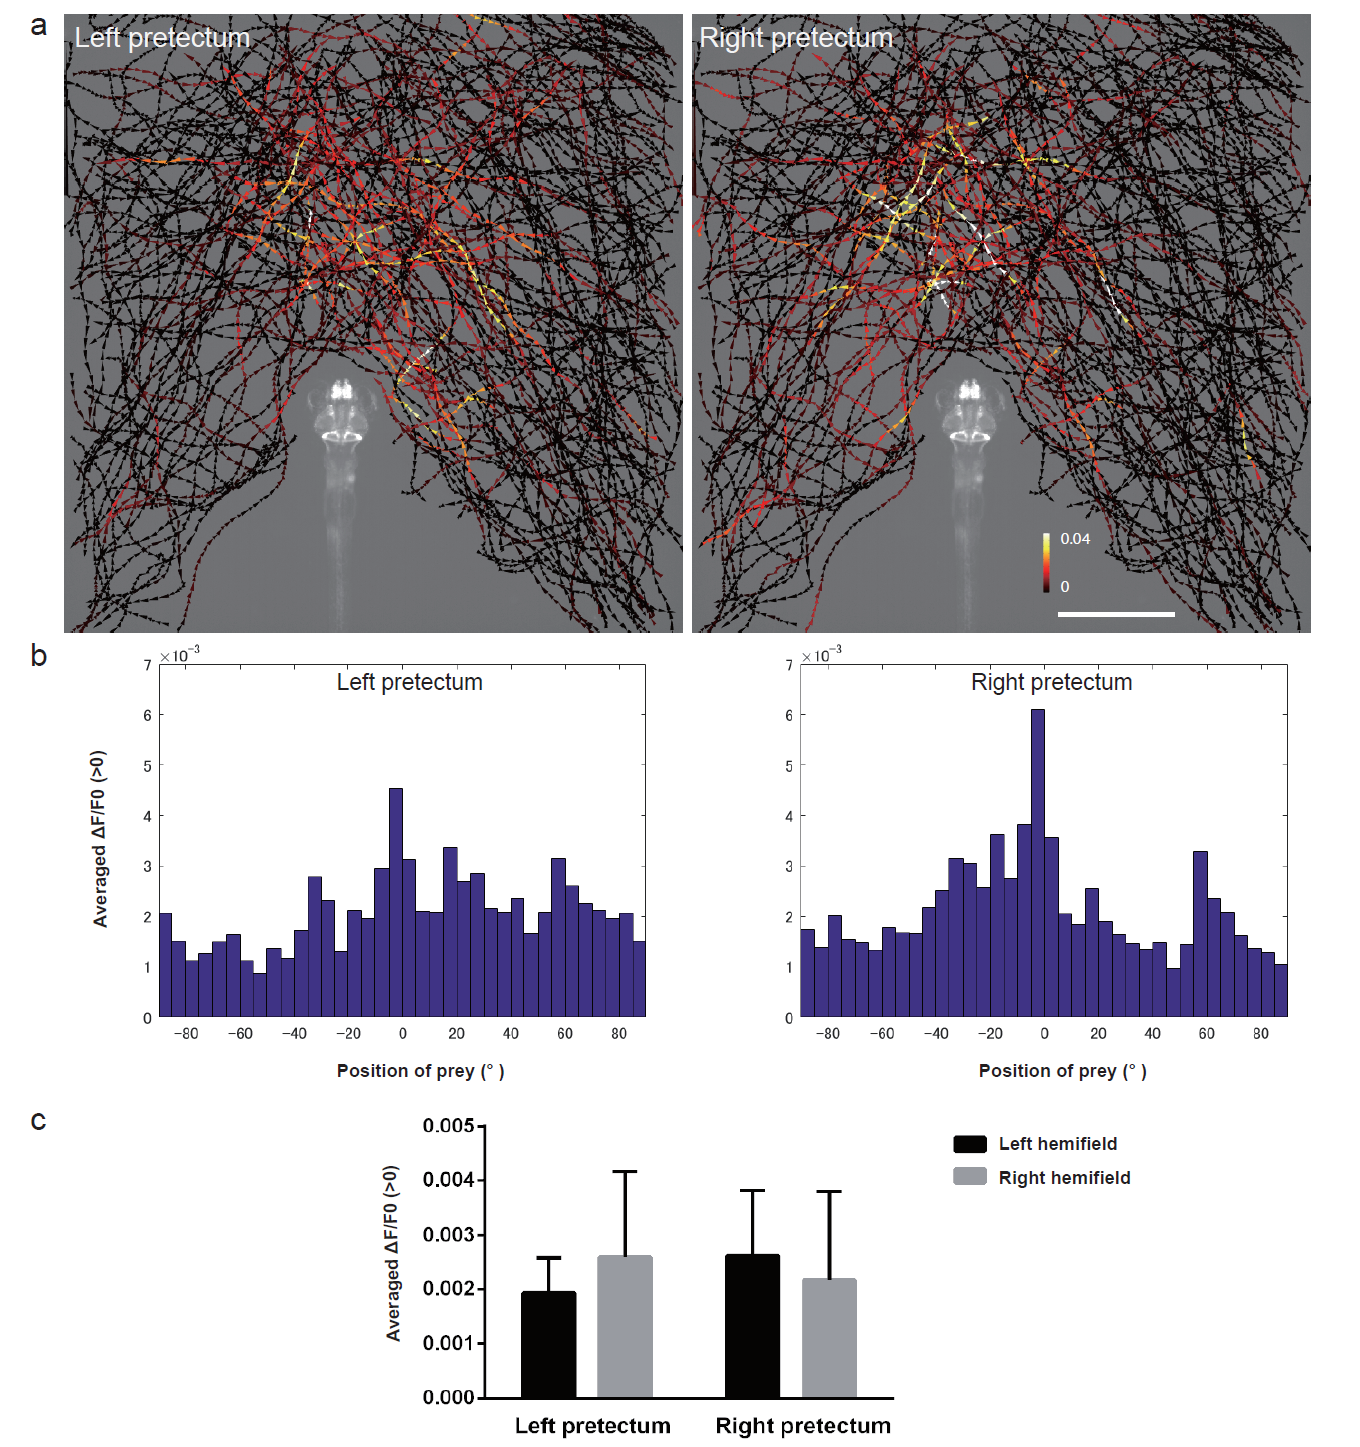
Activity in the pretectal cells at the sight of prey
a, The trajectories of single paramecia over 775 s are shown with the colour-coded changes in the intensity of GCaMP6s fluorescence in the pretectum in 5 dpf UAShspGCaMP6s; gSAIzGFFM119B larvae. The data from 4 larvae are merged into a single larval image. Scale bar: 1 mm. The length of the arrowhead represents the distance travelled by the paramecium in 60 ms. b, Average increase in the Ca signals in each 5° bin. The data are the same as those shown in a. c, Averaged increase in the Ca signals in the left and right hemifields. The data are the same as those shown in a. Mean ± S.D.