
|
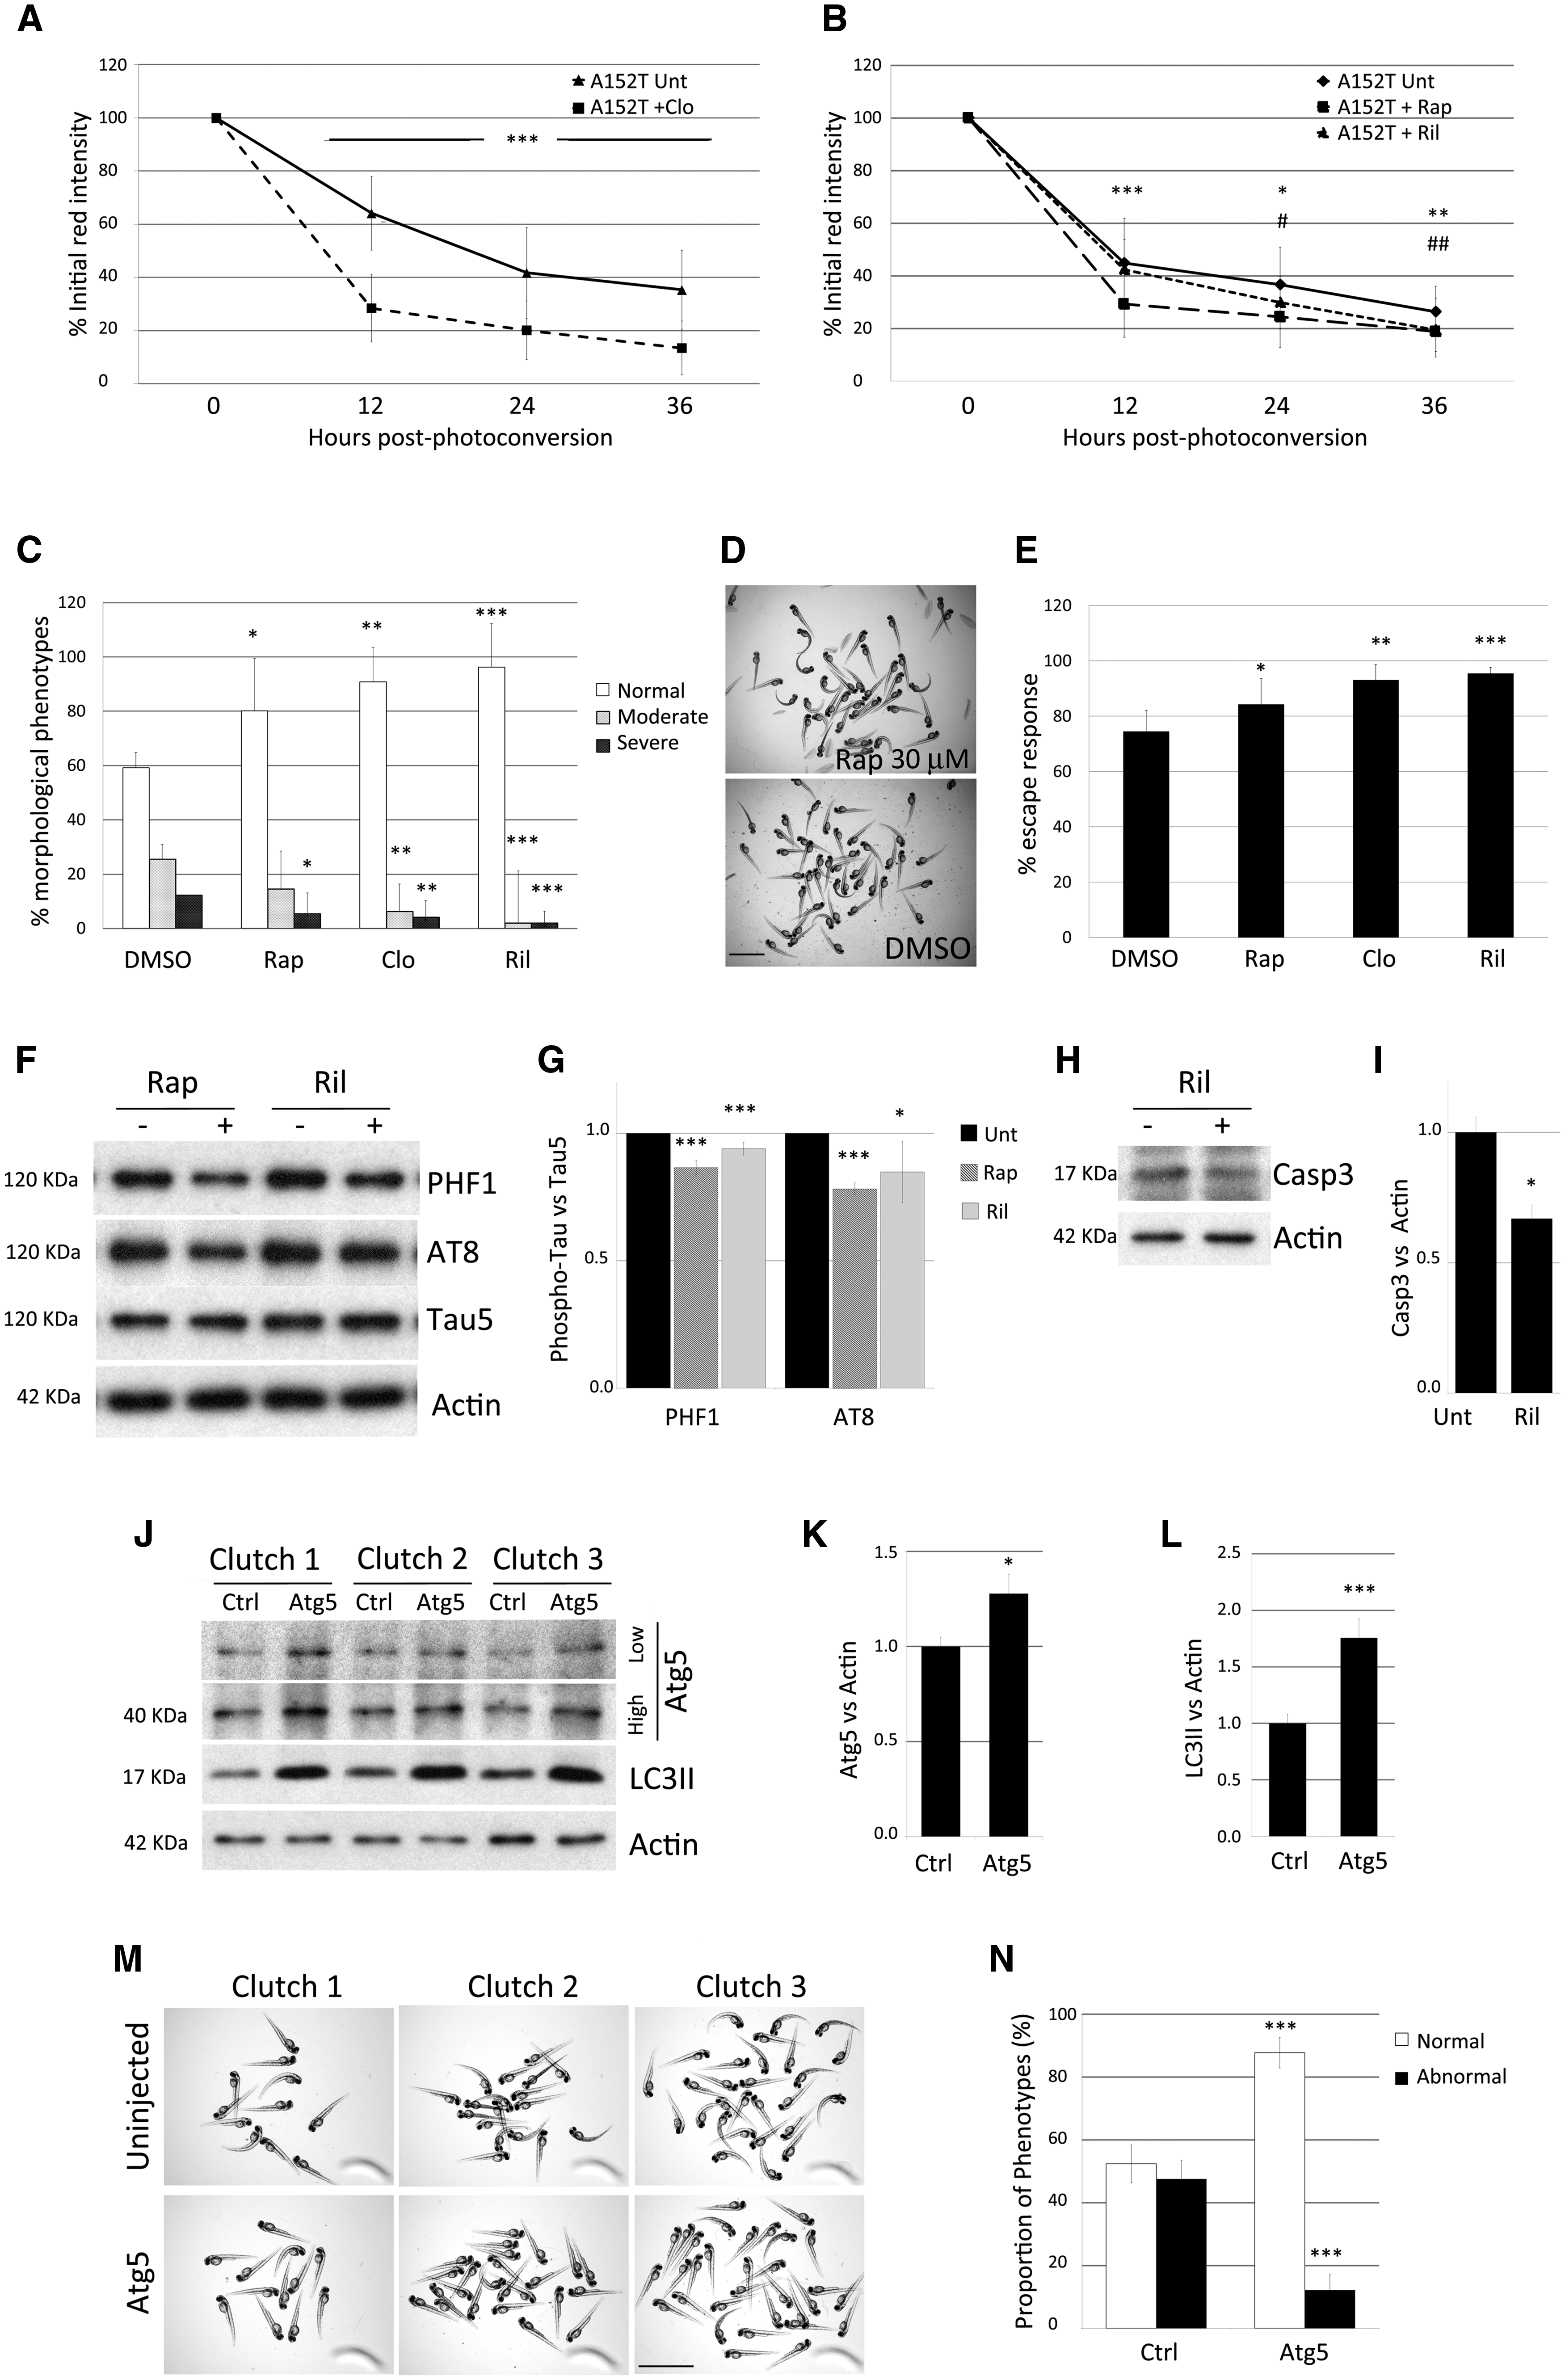
Fig. 7
Modulation of A152T-tau clearance and pathology by upregulation of autophagy. (A and B) Treatment of A152T-tau fish with the autophagy inducers clonidine (A), rapamycin or rilmenidine (B), accelerated clearance kinetics of A152T-tau (mean ± SD of n ≥ 40 neurons/group; Student-Newman-Keuls one-way ANOVA, */#P < 0.05; **/##P < 0.01 ***P < 0.001 versus untreated). (C) Treatment with rapamycin (rap), clonidine (clo) or rilmenidine (ril) also ameliorated morphological defects in A152T-tau transgenic fish (n = 6 independent experiments, 20 fish/group, mean ± SD; Student-Newman-Keuls one-way ANOVA, *P < 0.05; **P < 0.01 and ***P < 0.001 versus DMSO). (D) Representative image showing rapamycin treatment reduced the proportion of abnormal A152T-tau fish. Scale bar = 3.5 mm. (E) Quantification of the escape response measured in individual A152T-tau fish 3 dpf, treated with either DMSO, rapamycin, clonidine or rilmenidine. (n = 5 independent experiments in triplicate, 15/group shown as mean ± SD; two-tailed t-test: *P < 0.05, **P < 0.01 and ***P < 0.001 versus DMSO). The treatment with autophagy upregulators improved the escape response deficit in A152T-tau fish. (F and G) Induction of autophagy by the addition of rapamycin or rilmenidine to A152T-tau fish also reduced levels of phosphorylated tau at residues Ser202/Thr205 (AT8) and Ser396/Ser404 (PHF1) relative to total tau levels (n = 3 independent experiments in duplicate, 10/group shown as mean ± SEM; two-tailed t-test: *P < 0.05 and ***P < 0.001 versus DMSO). (H and I) Treatment with autophagy upregulators results in less cell death. Rilmenidine treatment reduced the levels of active caspase-3 (n = 4 independent experiments in triplicate, 10/group shown as mean ± SEM; two-tailed t-test: *P < 0.05 versus DMSO). (J–N) Injection of an expression vector encoding zebrafish atg5 into A152T-tau fish embryos resulted in over-expression of Atg5 protein at 2 dpf (J and K) (high and low exposure of the same blot presented; mean ± SD, n = 6 independent clutches; two-tailed t-test, *P < 0.05 versus control). (J and L) The increase in Atg5 protein correlated with increase in LC3II, a well-characterized reporter for autophagosome number, demonstrating that autophagy was upregulated in Atg5-injected fish (mean ± SEM, n = 8 independent clutches; two-tailed t-test, ***P < 0.001 versus control). (M and N) A consistent reduction in the number of offspring with morphological defects was observed in Atg5-injected fish compared to control (uninjected) siblings. The percentage of normal fish changes from 52.43% ± 6.01 to 87.79% ± 4.87 after Atg5 injection and consequently, the proportion of abnormal fish diminishes from 47.57% ± 6.01 to 12.21% ± 4.87 (mean ± SEM of seven independent clutches; two-tailed t-test, ***P < 0.001 versus control).