
Fig. 7 S1
- ID
- ZDB-IMAGE-170517-40
- Publication
- Anelli et al., 2017 - Oncogenic BRAF disrupts thyroid morphogenesis and function via Twist expression
- All Figures
- Figures for Anelli et al., 2017
|
Fig. 7 S1
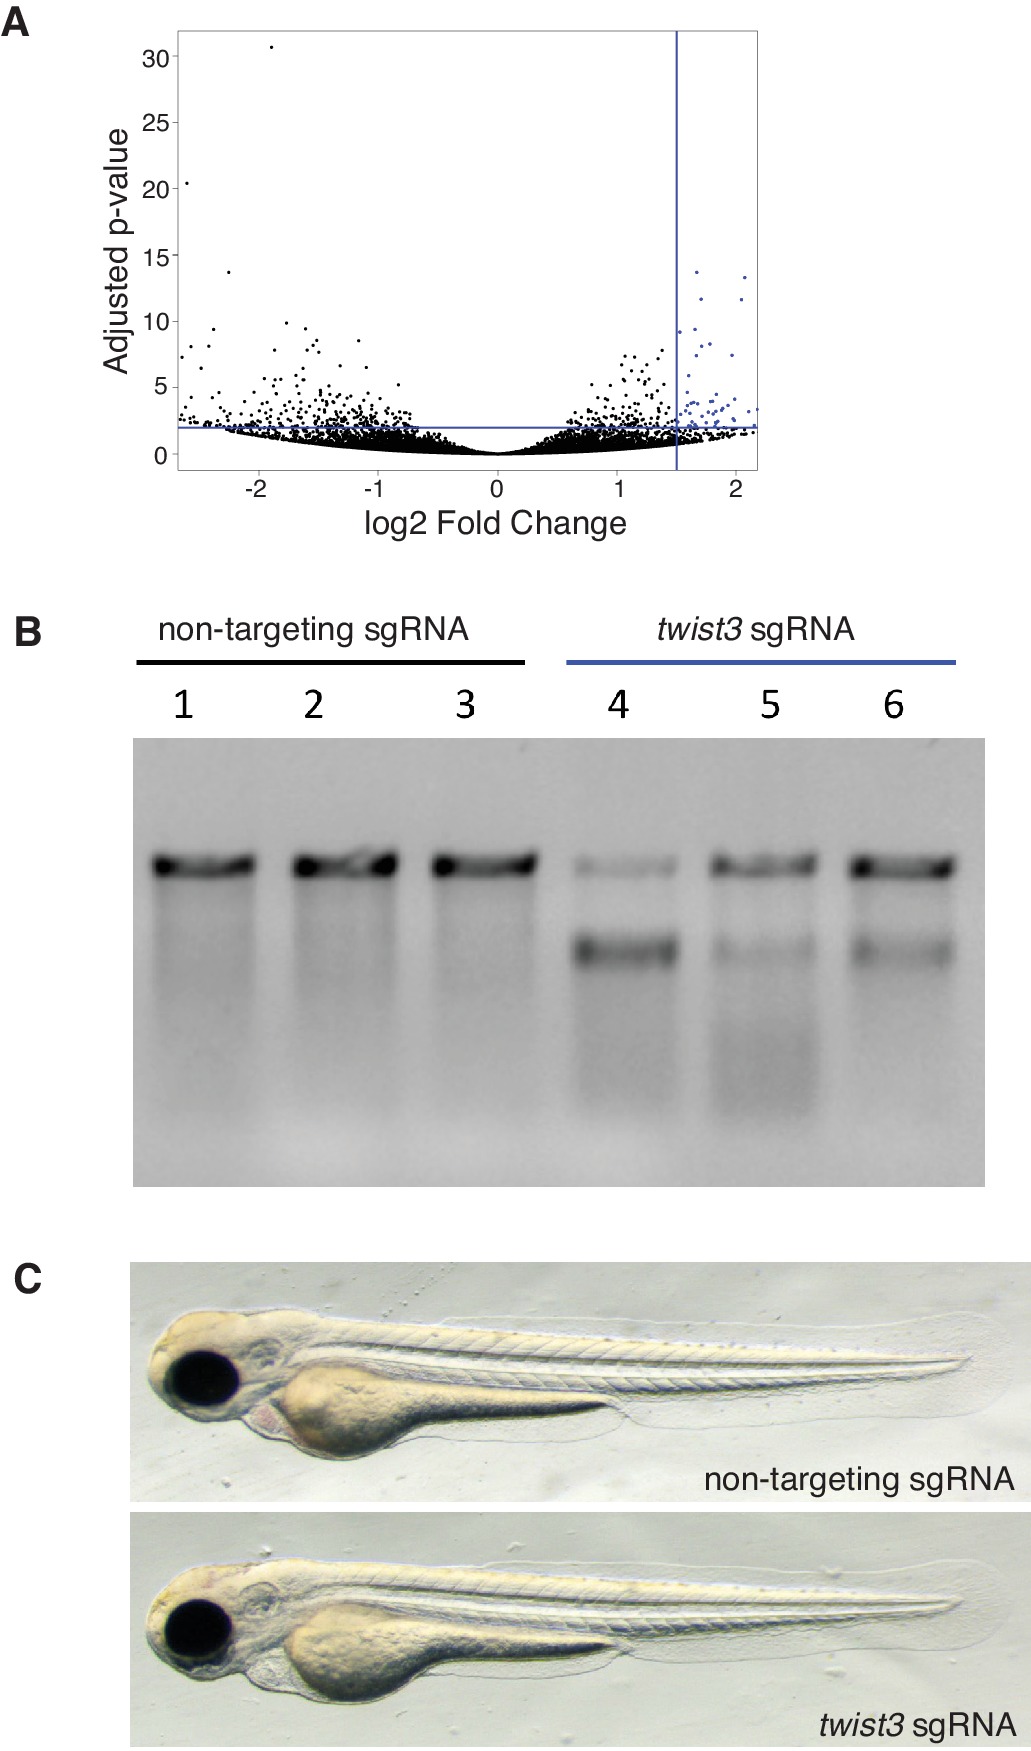
Validation of gene editing in thyrocytes and identification of a BRAFV600E gene signature.
(A) Volcano plot depicting differentially expressed genes in tg-BRAFV600E-TOM compared to tg-TOM sorted thyrocytes from larvae. Genes significantly upregulated in BRAFV600E thyrocytes are highlighted in blue (n = 85 genes, FDR ≤ 0.01; FC ≥ 1.5, Figure 7—source data 1). (B) T7 mutagenesis assay at the CRISPR target site in the twist3 gene. The assay was performed on genomic DNA from 1dpf embryos injected with either non-targeting sgRNA or twist3 targeting sgRNA and rCas9. Cleavage bands indicate cleavage of hetero-duplex DNA consistent with the presence of mutations at the target site. (C) Photograph of representative 5dpf embryos injected with either non-targeting sgRNA or twist3 sgRNA and rCas9. No significant morphologic defects are noted.