
|
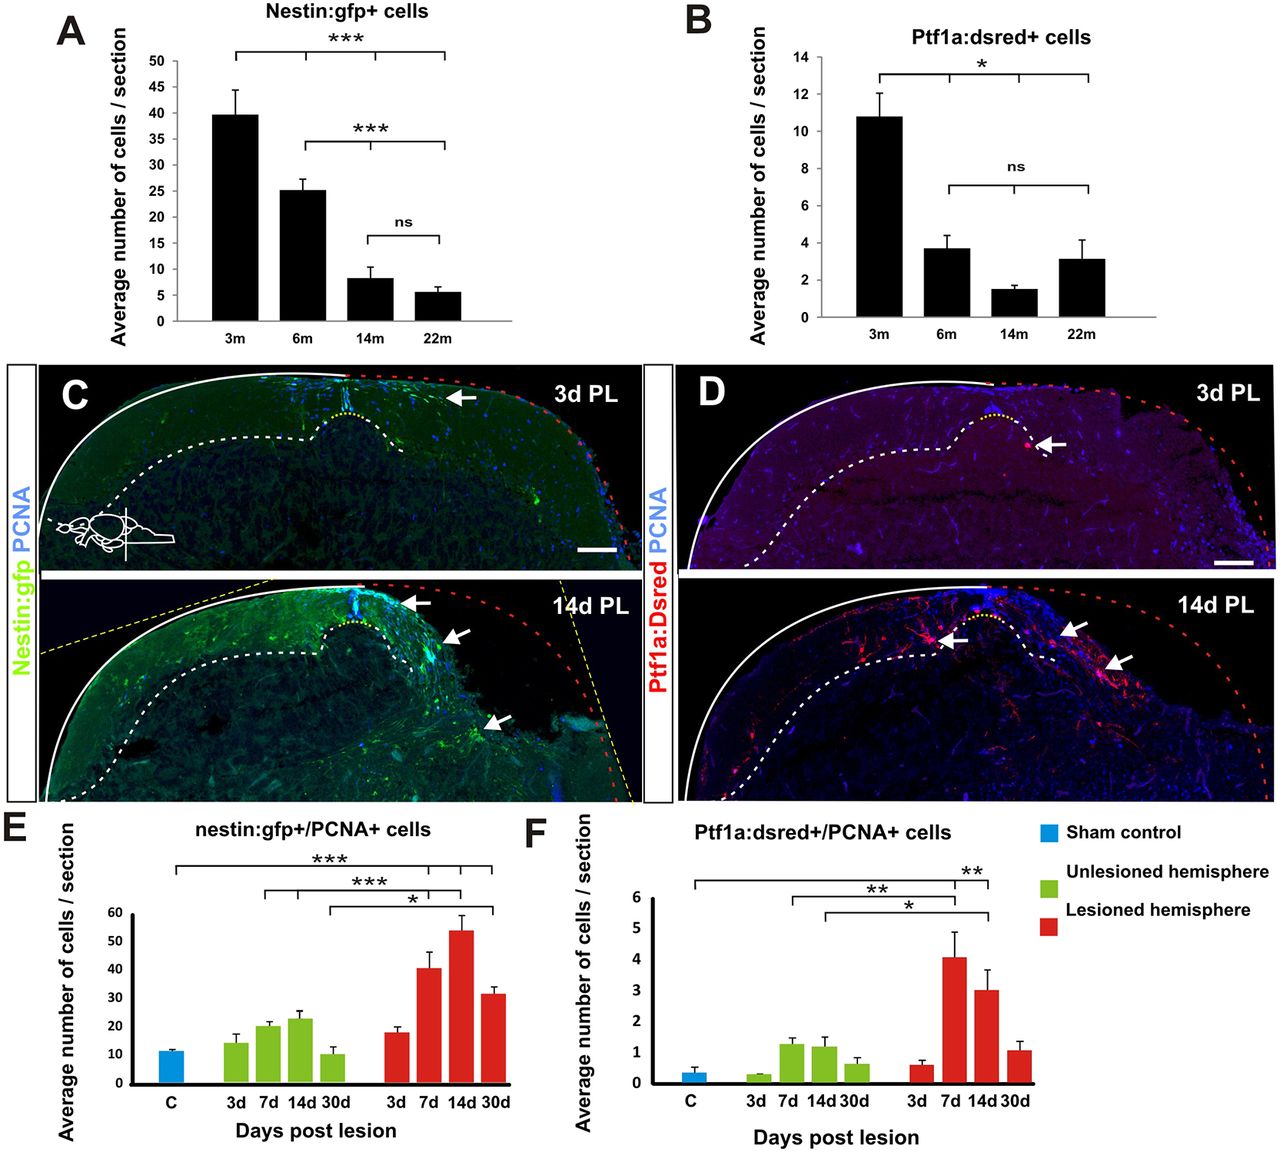
Fig. 2
Stem and progenitor cell response to cerebellar injury. (A,B) Quantification of nestin:gfp and ptf1a:DsRed cells in the aging cerebellum during homeostasis. nestin:gfp: n=5 at 3, 6 and 22 months, n=6 at 14 months, ***P<0.001; ptf1a:DsRed: n=7 at 3, 6 months, n=6 at 14 months, n=5 at 22 months, *P<0.05; error bars indicate s.e.m. (C,D) Maximum projections of cerebellar transverse sections showing stem cell activation after injury. Initially, the tissue morphology is severely altered at the level of the injury and therefore sections from the very rostral end of the lesion were chosen to show the stem cell response. Three days after the lesion, both ptf1a:DsRed+ (red) and nestin:gfp+ (green) stem cell activity (arrows) is unaltered. Stem cell activity (arrows) is significantly increased 7 days after injury and peaks ∼2 weeks after injury. Proliferating cells are labelled with Pcna (blue). (E,F) Quantification of cerebellar stem cell activity after injury. A significant increase in the number of nestin:gfp+ cells is seen from 7 to 30 days after the lesion. Sham control n=5, 3 DPL n=4, 7 DPL n=6, 14 DPL n=5, 30 DPL n=5; *P<0.05, ***P<0.001; error bars indicate s.e.m. A significant increase in ptf1a:DsRed+ stem cells is detected 7 and 14 days after injury. Sham control n=7, 3 DPL n=4, 7 DPL n=5, 14 DPL n=5, 30 DPL n=5; *P<0.05, **P<0.01; error bars indicate s.e.m. Note the differences in scale on the y-axis between E and F (60 versus 6 cells). Yellow dashed line shows original picture border in rotated images. Scale bars: 100 μm.