
Fig. 4
- ID
- ZDB-IMAGE-170516-8
- Antibodies
- Publication
- Kärpanen et al., 2017 - An Evolutionarily Conserved Role for Polydom/Svep1 During Lymphatic Vessel Formation
- All Figures
- Figures for Kärpanen et al., 2017
|
Fig. 4
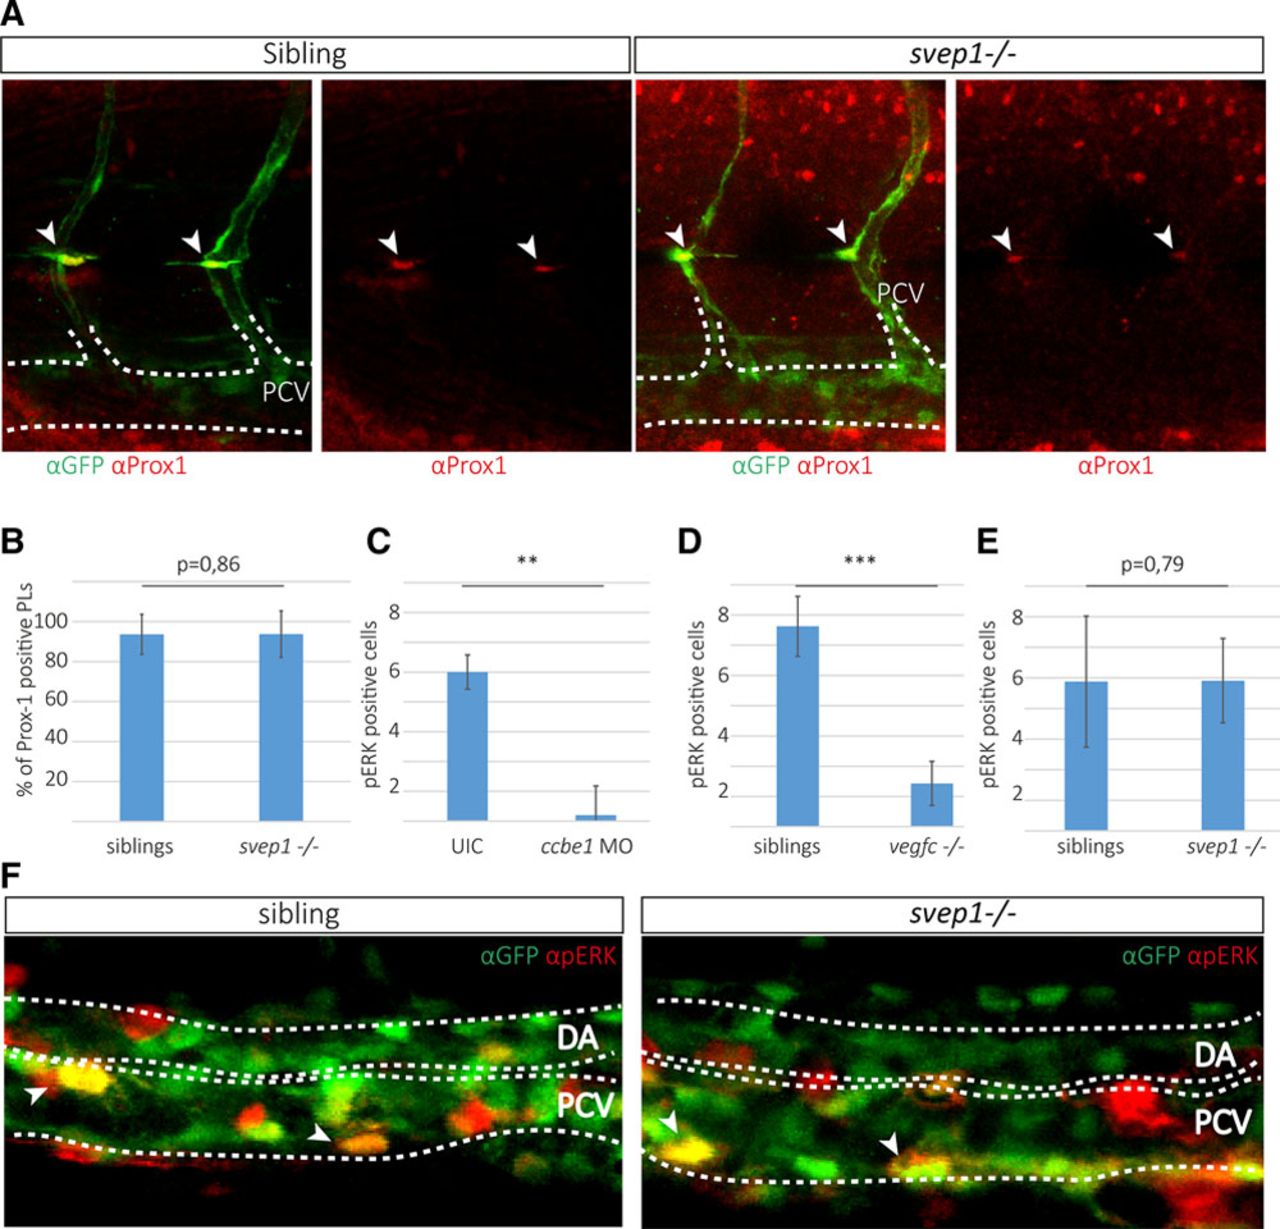
Posterior cardinal vein (PCV) cells express pERK and parachordal lymphangioblast (PL) cells express Prox-1 in svep1 mutant embryos. A, Partial maximal projection of antibody staining against Prox-1 (red) and fli1a:GFP (green) in embryos from an svep1+/−; fli1a:GFP incross at 48 h post-fertilization (hpf). Prox-1–positive PL cells are indicated by an arrowhead. B, Quantification of Prox-1–positive PL cells across 9 somites at the horizontal myoseptum (HMS) in siblings (96 out of 106 counted PLs are Prox-1 positive in 18 embryos) and svep1 mutants (28 out of 30 PLs are Prox-1 positive in 8 mutant embryos). C–E, pERK-positive cells were quantified in the PCV by scoring RFP and GFP coexpression (indicated by arrows) laterally across 6 somites in the trunk. C, In ccbe1 morpholino (MO) injected embryos (total number of 6 pERK-positive cells in 5 ccbe1 morphants; total number of 36 pERK-positive cells in 6 uninjected controls) and (D) vegf-chu6410 mutants (total number of 17 pERK-positive cells in 7 mutants and 67 pERK-positive cells in 8 siblings), the amount of pERK-positive cells is significantly reduced, whereas in svep1 mutants (E and F) no difference in pERK can be detected in the PCV (total number of 151 pERK-positive cells in 31 siblings compared with 48 pERK-positive cells in 9 svep1 mutants). F, Partial maximal projections of antibody staining against pERK (red) and fli1a:EGFP (green) in svep1+/−; fli1a:GFP incrosses show no difference in the amount of pERK-positive cells in the PCV at 32 hpf. Bar graphs show mean±SD. For statistical analysis, the Mann–Whitney test was applied in all panels.