
Fig. 4
- ID
- ZDB-IMAGE-170509-4
- Publication
- Pradhan et al., 2017 - FGF signaling enforces cardiac chamber identity in the developing ventricle
- All Figures
- Figures for Pradhan et al., 2017
|
Fig. 4
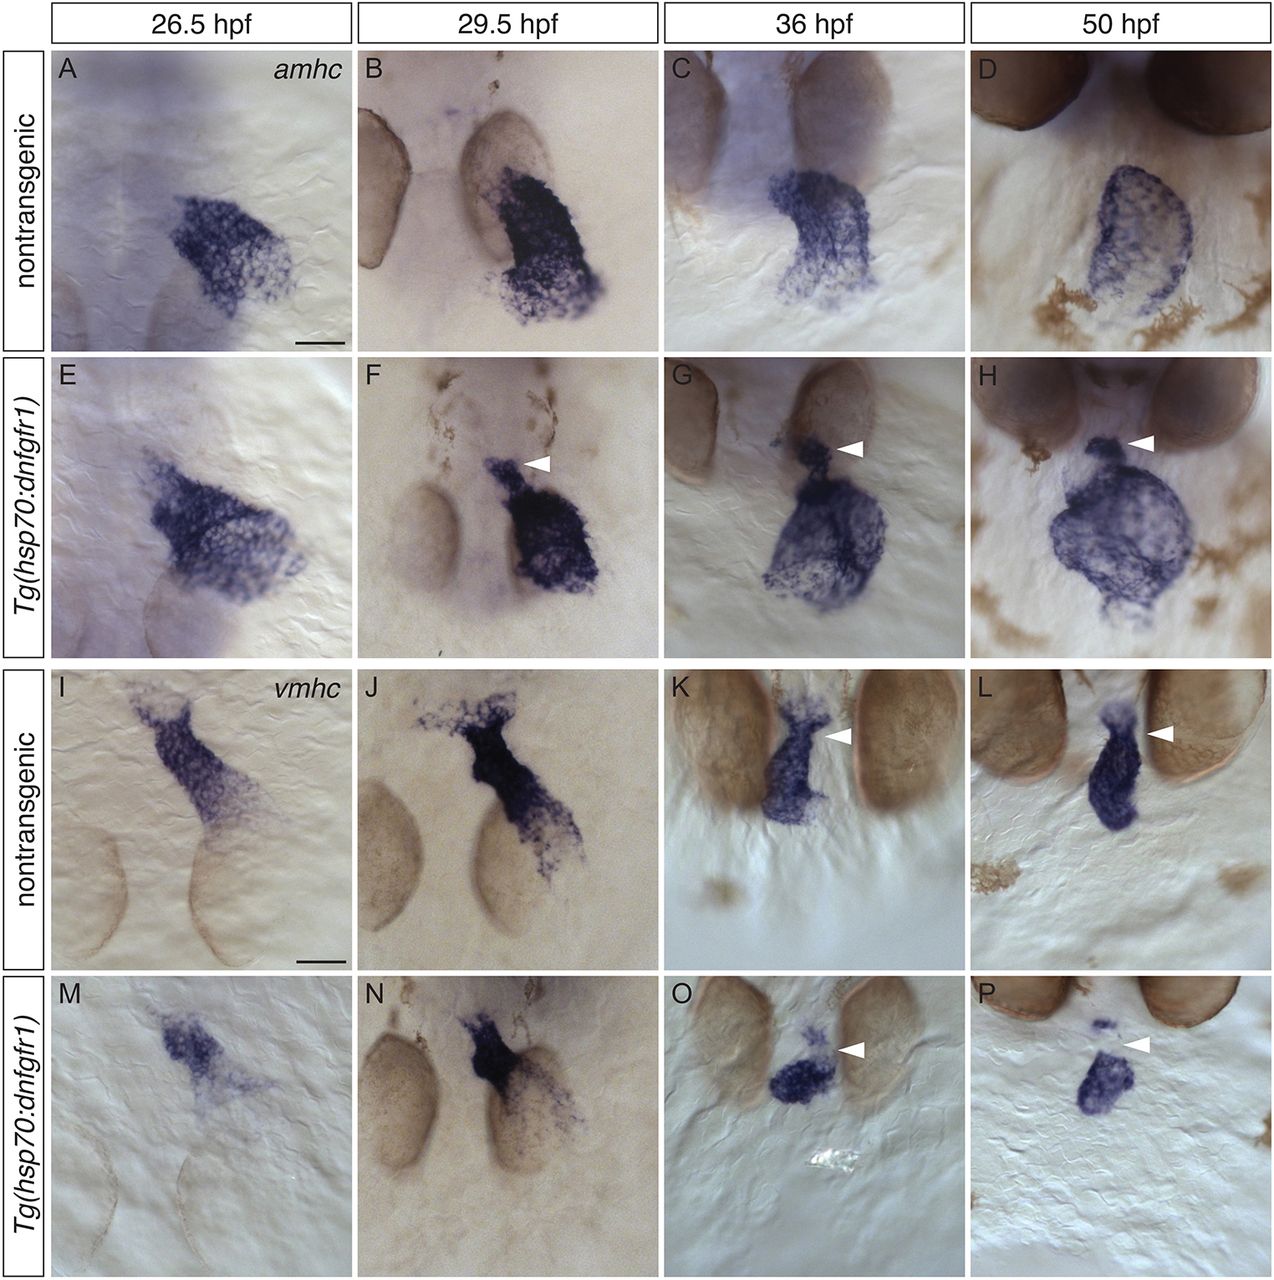
Increased expression of amhc and reduced expression of vmhc in the ventricle of embryos with reduced FGF signaling. (A-P) In situ hybridization showing amhc (A-H) and vmhc (I-P) expression in dorsal (A,B,E,F,I,J,M,N) and frontal (C,D,G,H,K,L,O,P) views, following heat shock at 18 hpf. (A-H) In contrast to nontransgenic embryos (A-D), Tg(hsp70:dnfgfr1) embryos (E-H) fail to restrict amhc to the atrium (n>10 each). (E) At 26.5 hpf, amhc-expressing cells can be seen infringing the boundary between the atrium and the ventricle. (F) By 29.5 hpf, amhc levels in ectopic cells are upregulated (arrowhead). (G,H) A prominent population of ectopic cells is found at the inner curvature and arterial pole of the ventricle (arrowheads). (I-P) Whereas vmhc is robustly expressed in the ventricle of nontransgenic embryos (I-L), this expression pattern is disrupted in Tg(hsp70:dnfgfr1) embryos (M-P) (n>10 each). (M,N) At early stages, Tg(hsp70:dnfgfr1) embryos display lower levels of vmhc expression in regions adjacent to the atrium. (O,P) As development proceeds, vmhc levels at the arterial pole become reduced or absent (arrowheads); moreover, the vmhc expression pattern appears to be reciprocal to that of ectopic amhc in the ventricle. Scale bars: 50 μm.