
Image
|
Figure Caption
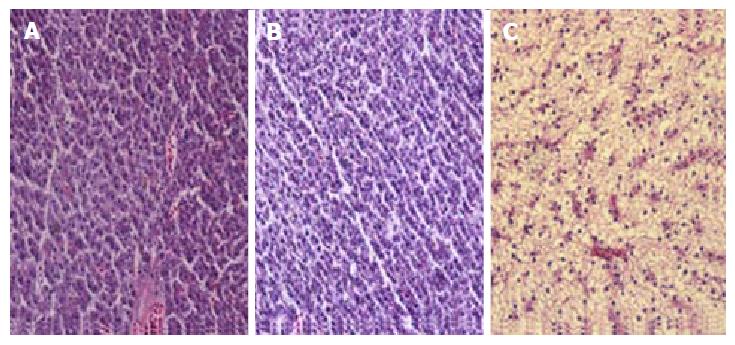
Fig. 1
Hematoxylin-eosin staining of liver sections from zebrafish. A: C group (2 wk), the hepatocytes are aligned in cords, absence of fat droplets; B: E group (2 wk), without apparent changes compared with the C group; C: E group (4 wk), enlarged hepatocytes due to fatty infiltration. Magnification: 400 ×.
Figure Data
Acknowledgments
This image is the copyrighted work of the attributed author or publisher, and
ZFIN has permission only to display this image to its users.
Additional permissions should be obtained from the applicable author or publisher of the image.
Full text @ World J Hepatol