
Fig. 1
- ID
- ZDB-IMAGE-170428-26
- Genes
- Publication
- El-Rass et al., 2017 - Disruption of pdgfra alters endocardial and myocardial fusion during zebrafish cardiac assembly.
- All Figures
- Figures for El-Rass et al., 2017
|
Fig. 1
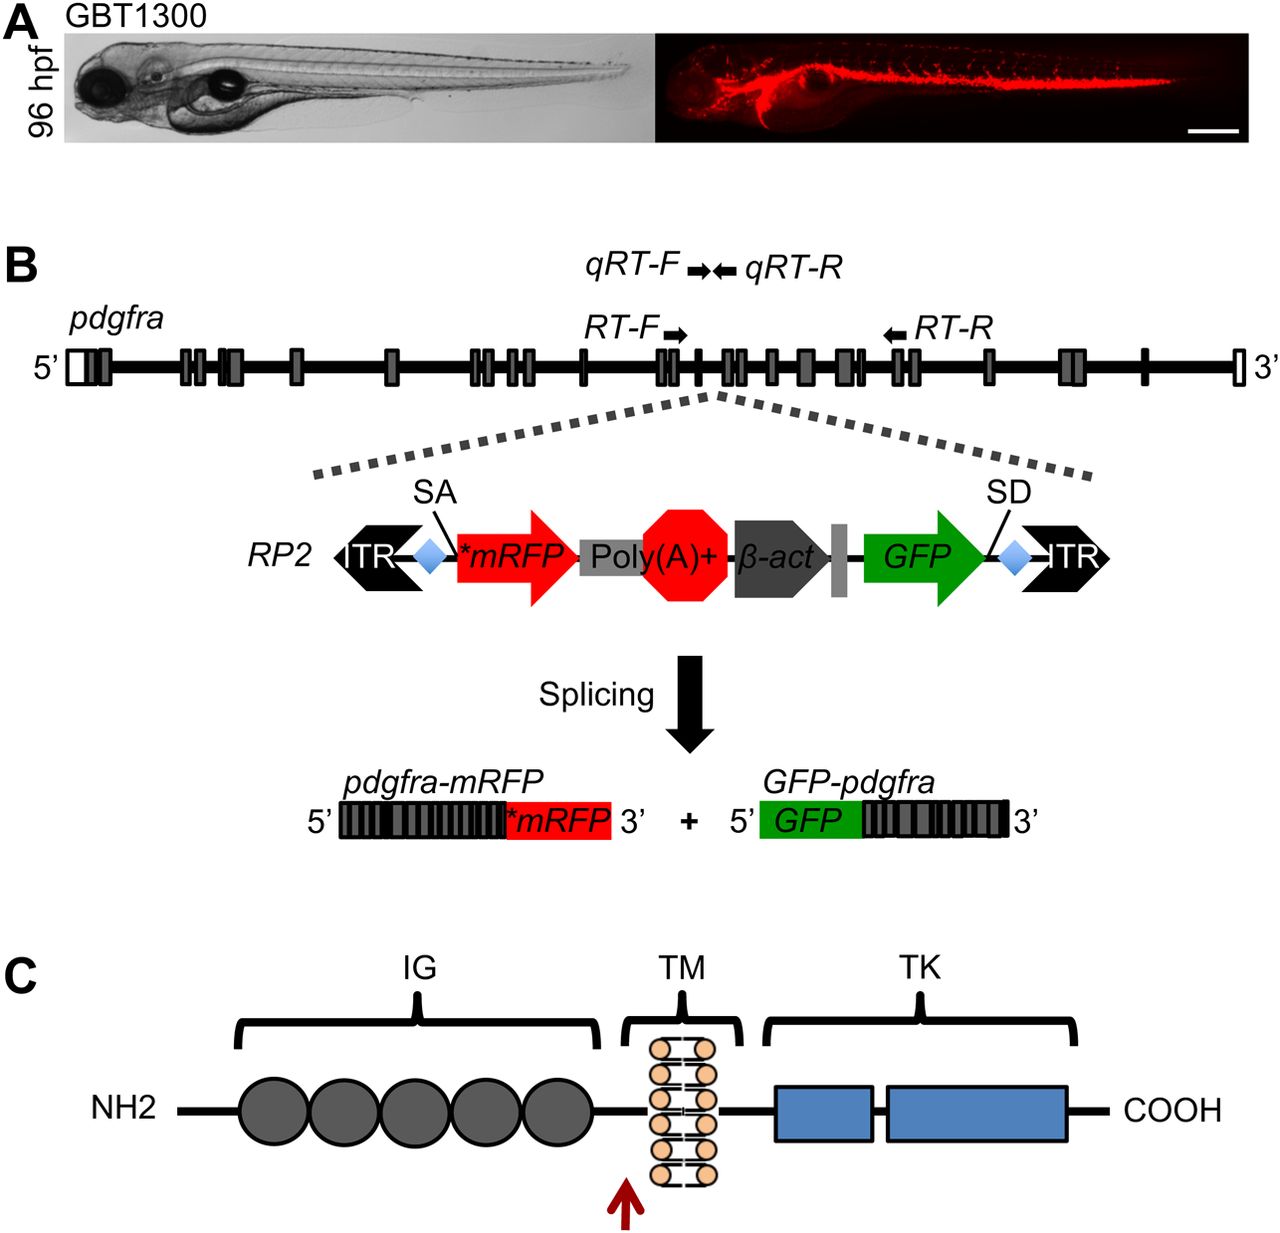
RP2 Transposon integration disrupts pdgfra gene. (A) Bright field (left) and fluorescent (right) images of heterozygous GBT1300 larva showing mRFP expression pattern at 96 hpf. (B) Schematic representation of zebrafish pdgfra gene showing the locus of RP2 insertion in intron 16, and the resulting truncated pdgfra-mRFP and GFP-pdgfra fusion transcripts. Gray boxes indicate exons; lines indicate introns. Primers used for reverse transcription (RT)- and quantitative real-time (qRT)-PCR are denoted. (C) Schematic drawing of zebrafish Pdgfra protein domains, showing the site of mRFP fusion (red arrow). IG, immunoglobulin; TM, transmembrane; TK, tyrosine kinase. Scale bar: 500 μm in A.