
Fig. 3
- ID
- ZDB-IMAGE-170425-22
- Genes
- Publication
- Siegerist et al., 2017 - Acute podocyte injury is not a stimulus for podocytes to migrate along the glomerular basement membrane in zebrafish larvae
- All Figures
- Figures for Siegerist et al., 2017
|
Fig. 3
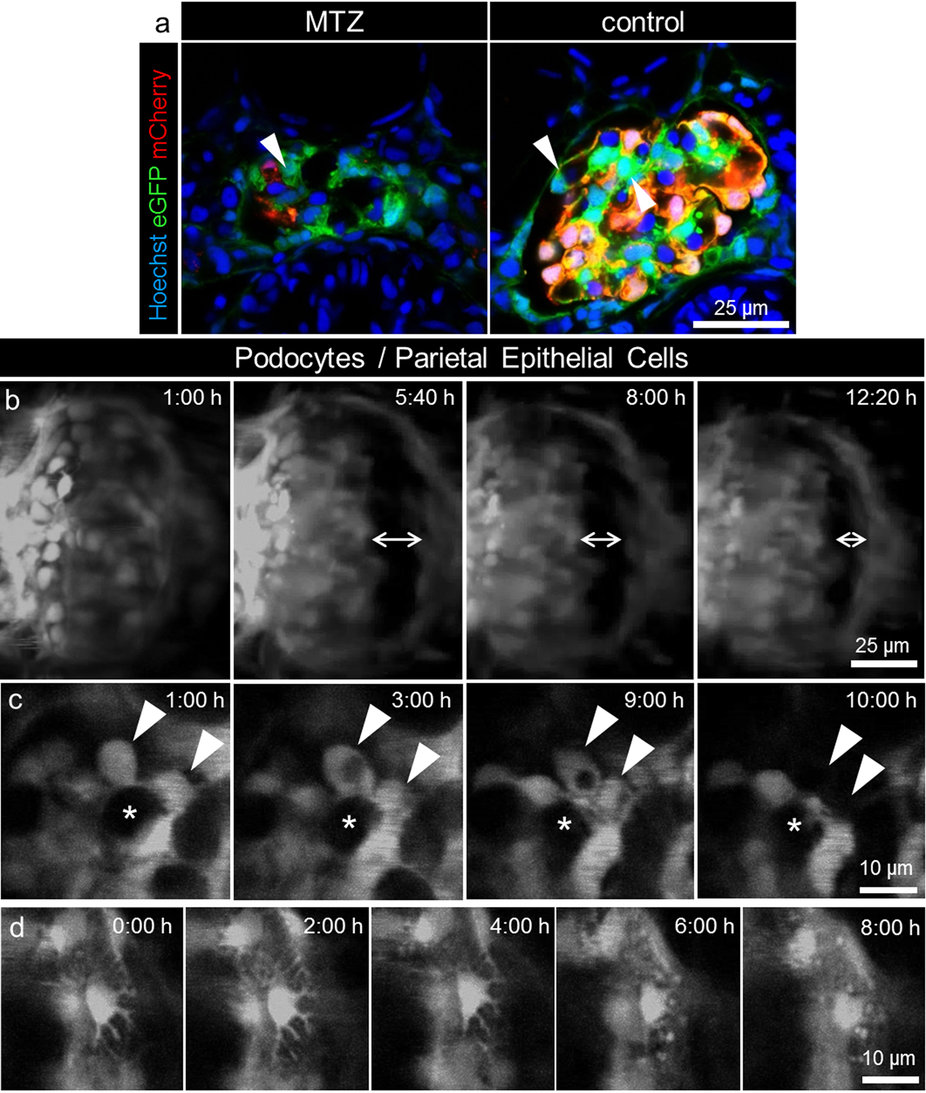
Long term in vivo two-photon imaging of podocyte injury.
The pictures of panel a show that a subset of podocytes (arrowheads) in Chet larvae at 4 dpf only express eGFP and not NTR-mCherry and therefore are not vulnerable to MTZ treatment (representative image of n = 3 experiments, scale bar represents 25 μm). Panel b shows the morphological changes in the glomerulus during treatment with 5 mM MTZ as seen in the 3D reconstructions of long term 2-PM of Chet larvae beginning at 4 dpf. After approximately 5 hours, dilation of Bowman’s space occurred which decreased in the following time as shown by the double arrows at t = 5:40, 8:00, 12:20 hours (scale bar represents 25 μm). Panel c shows single frames of the detachment of two adjacent podocytes (arrowheads) between t = 9 and 10 hours (asterisks indicate a capillary loop which is covered by podocytes, scale bar represents 10 μm). The time series of single frames over 8 hours in panel d shows retraction of major processes of a single podocyte during treatment with 5 mM MTZ (scale bar represents 10 μm).