
|
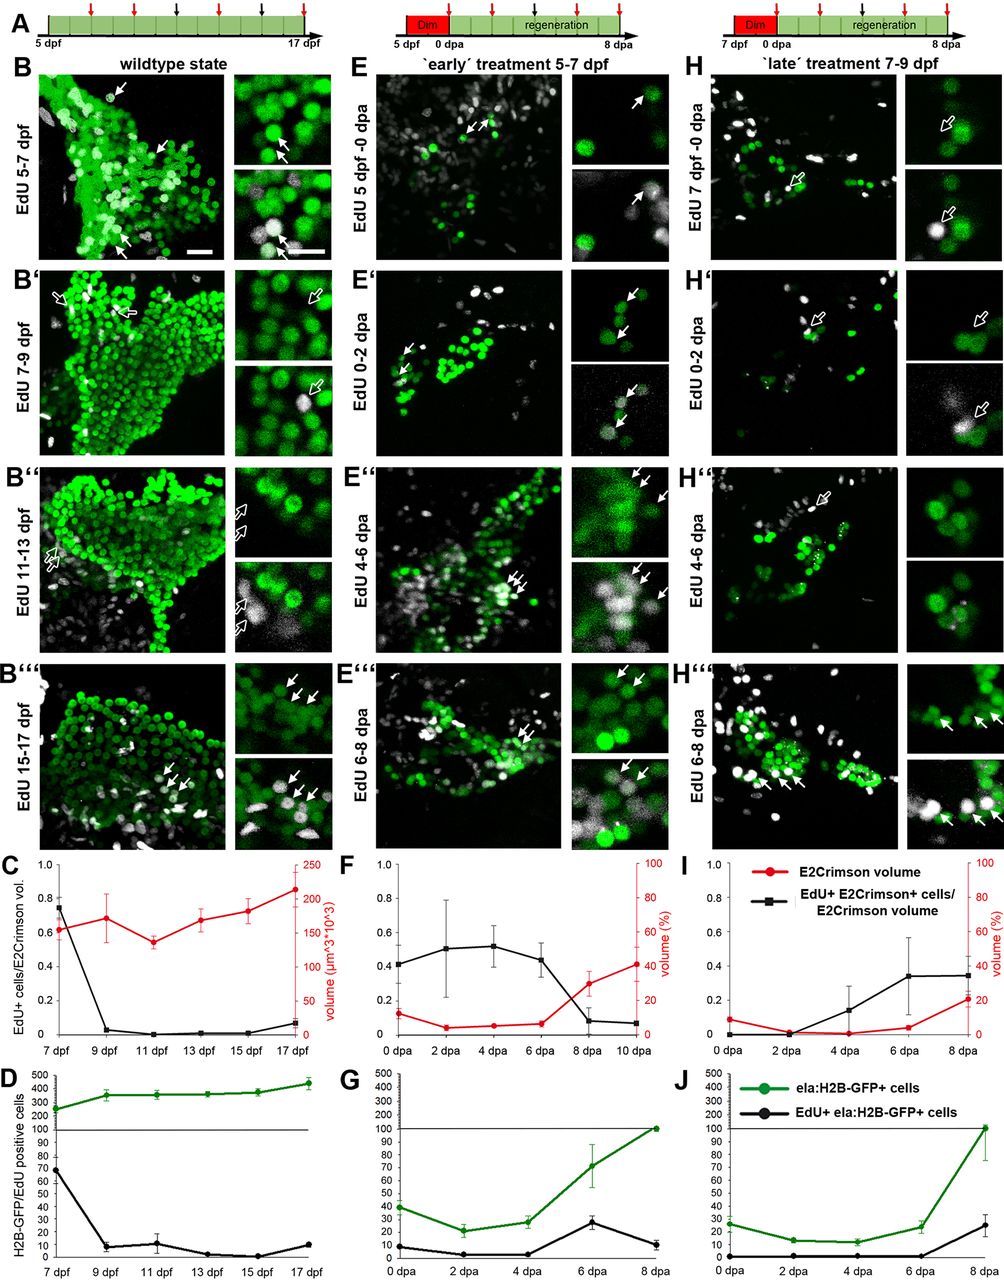
Fig. 3
Dynamics of exocrine development and regeneration. (A) Time scheme of regeneration experiments indicating phase with Dim treatment (in red) and time points of fixation (arrows). (B,E,H) Confocal images of Tg(ela:casp8;ela:H2B-GFP) animals at different stages of larval development (stages as indicated by red arrows in A). All larvae were treated with EdU for 48 h before fixation (GFP signals in green, EdU signals in white, smaller white dots correspond to E2Crimson background). Images cover the pancreatic head region of untreated (B-B′″) animals and of larvae treated with 5 µM Dim either from 5 to 7 dpf (E-E″′, ‘early’ treatment) or from 7 to 9 dpf (H-H′″, ‘late’ treatment). Shown are projections and selections of single plane images (smaller images to the right). Note that ‘late’ treatment larva between 0-6 dpa lack EdU+ GFP+ cells (white arrows) and that EdU+ signals in 9 dpf and 13 dpf control animals (B′,B″) and in 0-6 dpa late treatment larvae (H-H″) localized to GFP-negative nuclei (black arrows). (C,D,F,G,I,J) Data quantification (n>5 larva for each time point; mean+s.e.m.) using volumetric measurements (C,F,I) and cell counts (D,G,J: absolute numbers of nuclei per stack) for control larva (C,D), early treatment larvae (F,G) and late treatment larvae (I,J). Red line in C shows the absolute E2Crimson volume (in red), whereas in F and I, it shows the relative volume compared with the wild-type situation as shown in C. Note that different samples were analyzed in E-G and H-J, and that the higher proliferation rate in 11 dpf control animals shown in D compared with C result from only two larvae with 10 and 40 EdU+ cells (see Table S1). Scale bars: 20 µm.