
Fig. 7
- ID
- ZDB-IMAGE-170419-7
- Publication
- Ki et al., 2017 - Overexpression of PDGFRA cooperates with loss of NF1 and p53 to accelerate the molecular pathogenesis of malignant peripheral nerve sheath tumors
- All Figures
- Figures for Ki et al., 2017
|
Fig. 7
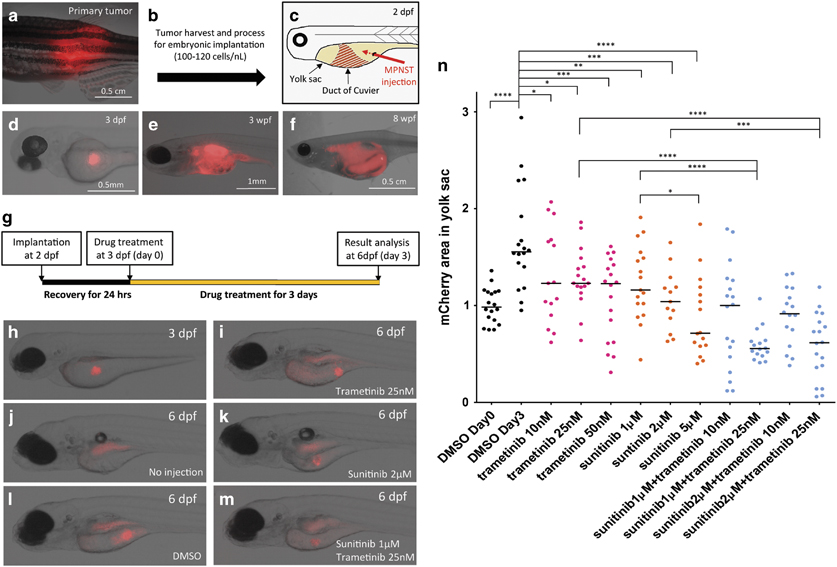
Sunitinib activity is enhanced when given in combination with the MEK inhibitor trametinib in an assay using implanted zebrafish MPNST cells. (a–f) Photomicrographs of mCherry expressing transplanted MPNST cells. (a) Primary zebrafish MPNSTs were harvested from wild-type PDGFRA transgenic fish, and (b) ~100–120 tumor cells were implanted into the yolk sac of a 2 d.p.f. embryo. (c) Illustration of our implantation. Red arrow represents direction of the microneedle for cell injection. (d) Representative image of implanted MPNST embryo at 3 d.p.f. (e) Injected MPNST cells were expanded and (f) formed tumor mass in embryos. (g) Schematic diagram of our implantation and drug treatment assay. MPNST cells were transplanted into 2 d.p.f. embryos and treated with drugs in the fish water from 3 to 6 d.p.f. (h–m) Representative fish images at 6 d.p.f. after drug treatment. Because autofluorescence was expressed from the embryo gut (j), mCherry expressed areas in yolk sac were only analyzed for this assay. (n) MPNST tumor cell growth in the yolk sac of the implanted embryos. These embryos were treated with vehicle control, trametinib, sunitinib or combinations of trametinib and sunitinib (n=20 per condition). The asterisks indicate the range of the different P-values of Student's t-test (*P<0.05; **P<0.01; ***P<0.001; ****P<0.0001). Black bar in each column scatter plot represents the median value.