
IMAGE
Fig. S12
- ID
- ZDB-IMAGE-170419-15
- Antibodies
- Publication
- Yun et al., 2017 - Oncogenic role of rab escort protein 1 through EGFR and STAT3 pathway
- All Figures
- Figures for Yun et al., 2017
Image
|
Figure Caption
Fig. S12
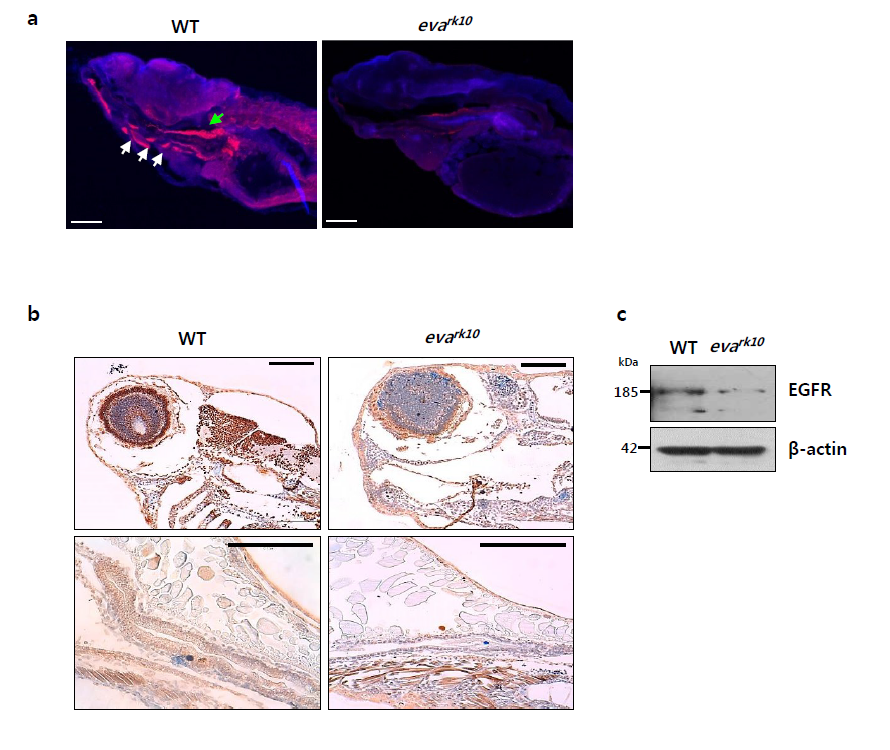
(a) Zebrafish frozen tissue sections were subjected to immunofluorescence assay using anti-EGFR antibody. Pharyngeal arch: white arrows; Esophagus: green arrow; EGFR: red; Nucleus; blue. Magnification: x50, Scale bar = 100 µm. (b) Paraffin-embedded zebrafish tissues were subjected to immunohistochemistry using anti-EGFR antibody. Scale bar = 100 µm. (c) Cell lysates from WT and evark10 mutant embryos at 5dpf were processed for immunoblot analysis using anti-EGFR and β-actin antibodies. β-actin was used as a loading control. Similar results were observed in two independent experiments.
Figure Data
Acknowledgments
This image is the copyrighted work of the attributed author or publisher, and
ZFIN has permission only to display this image to its users.
Additional permissions should be obtained from the applicable author or publisher of the image.
Full text @ Cell Death Dis.