
|
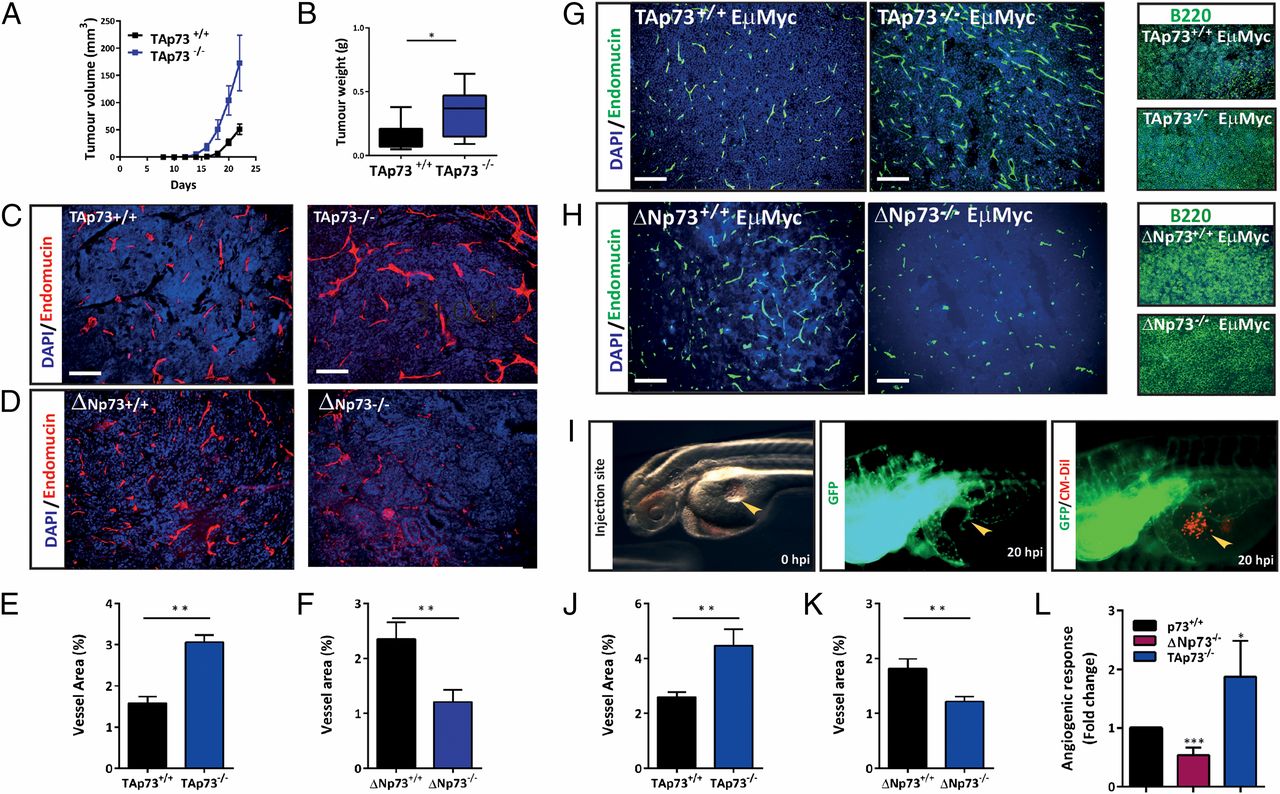
Fig. 1
TAp73-deficient cells form larger and more vascularized tumors compared with WT. (A) E1A/RasV12-transformed WT or TAp73−/− MEFs were injected s.c. into nude mice (n = 9/group), tumor growth was measured at a 2-d interval up to 22 d postinjection. Results are shown as the mean ± SEM, P < 0.0001. (B) Increased tumor weight in absence of TAp73 (TAp73−/−, 0.33 ± 0.07 g vs. WT, 0.14 ± 0.045 g; *P < 0.05) Results are shown as the mean ± SD. (C–F) Representative images and quantification of tumor vasculature in WT, TAp73−/−, and ΔNp73−/− tumors using anti-endomucin staining (red) on paraffin sections. In total, n = 14 TAp73−/−, n = 12 TAp73+/+, n = 4 ΔNp73−/−, and n = 4 ΔNp73+/+ tumors were analyzed and five fields/tumor were used for quantification. (G, H, J, and K) Images and quantification of vasculature in spontaneous B-cell lymphoma model in TAp73−/− (n = 3), ΔNp73−/− (n = 3), and WT (n = 3) tumors, using anti-endomucin staining (green) on paraffin sections. Five to 10 fields per tumor were used for quantification (**P < 0.01). (Right) B220 staining indicating all tumors analyzed are of B-cell origin. (I) Tumor cell xenografts into zebrafish embryos. (Left) 48 h postfertilization (hpf) Tg(fli:EGFP) embryos injected with CM-DiI–labeled MEFsE1A/Ras into the perivitelline space. (Middle) Injected embryo stage 72 hpf (20 h after injection) with a positive angiogenic response (arrowhead). (Right) Overlay with grafted cells (red). (L) Quantification of angiogenic response in zebrafish comparing three WT cell lines with three ΔNp73−/− or three TAp73−/− cell lines (all generated from paired litter mates). Results are presented as mean fold change ± SD compared with WT. Cells deficient for ΔNp73 show a reduced angiogenic response compared with WT [0.54 ± 0.06 vs. 1 (WT); ***P < 0.0005]; in contrast, TAp73−/− cells show an enhanced response [1.88 ± 0.35 vs. 1 (WT); *P < 0.05].