
|
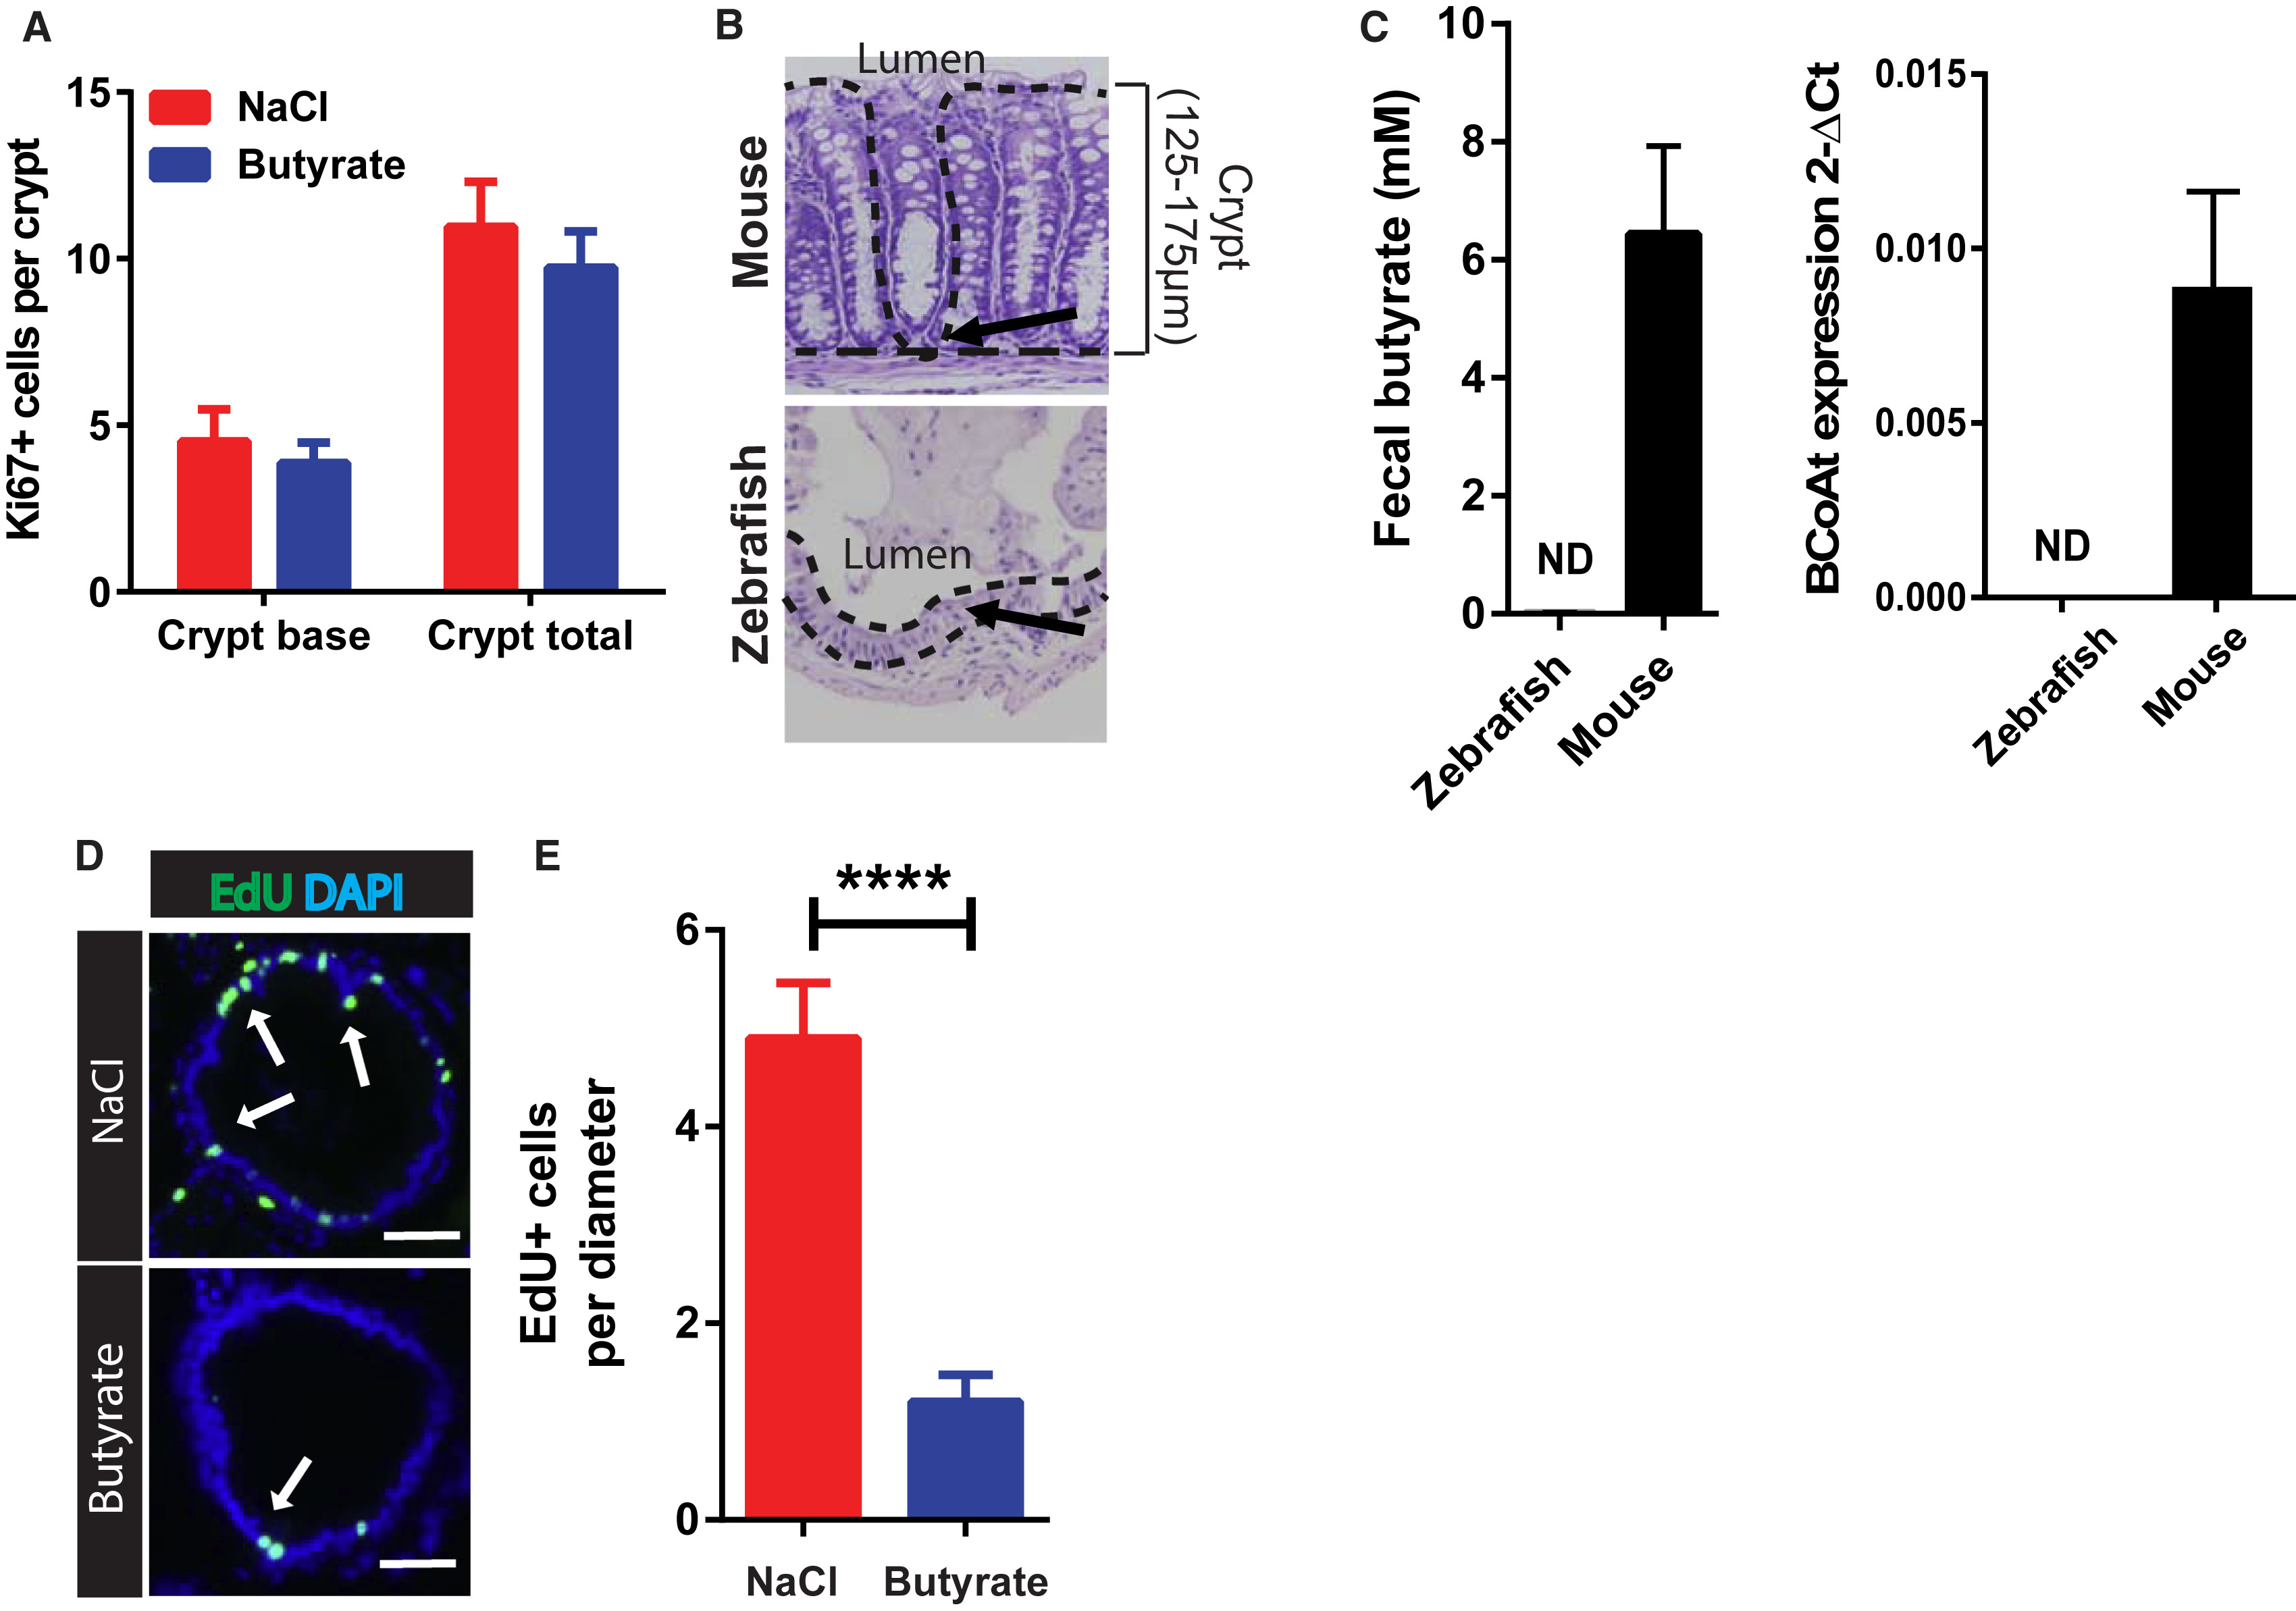
Fig. 3
Colonic Crypt Structure Protects Epithelial Stem/Progenitor Cells from Butyrate Suppression
(A) Number of Ki67+ cells per crypt at the colonic crypt base or total crypt in mice treated with enemas of NaCl or butyrate (n = 5).
(B) Representative images of mouse crypts and zebrafish inter-villus regions. Dashed lines indicate the epithelial architecture/crypt structure in mouse, which is absent in the zebrafish. Arrows depict the localization of stem/progenitor cells. Crypt height/distance from the lumen is also indicated.
(C) Fecal butyrate concentration and level of butyryl-coenzyme A (CoA) transferase (BCoAt) in fecal samples of each organism (n = 9 mice and five samples pooled from 15 zebrafish). ND, not detected.
(D) Representative images of EdU staining in intestinal bulge of zebrafish treated with NaCl or butyrate. White arrows indicate EdU+ epithelial cells (green).
(E) Average number of EdU+ epithelial cells per intestinal diameter in zebrafish treated with 50 mM NaCl or butyrate (n = 8–12 zebrafish), unpaired t test ∗∗∗p < 0.001. All values, mean ± SEM. Scale bars, 50 μm.
Reprinted from Cell, 165, Kaiko, G.E., Ryu, S.H., Koues, O.I., Collins, P.L., Solnica-Krezel, L., Pearce, E.J., Pearce, E.L., Oltz, E.M., Stappenbeck, T.S., The Colonic Crypt Protects Stem Cells from Microbiota-Derived Metabolites, 1708-20, Copyright (2016) with permission from Elsevier. Full text @ Cell