
|
Fig. 1
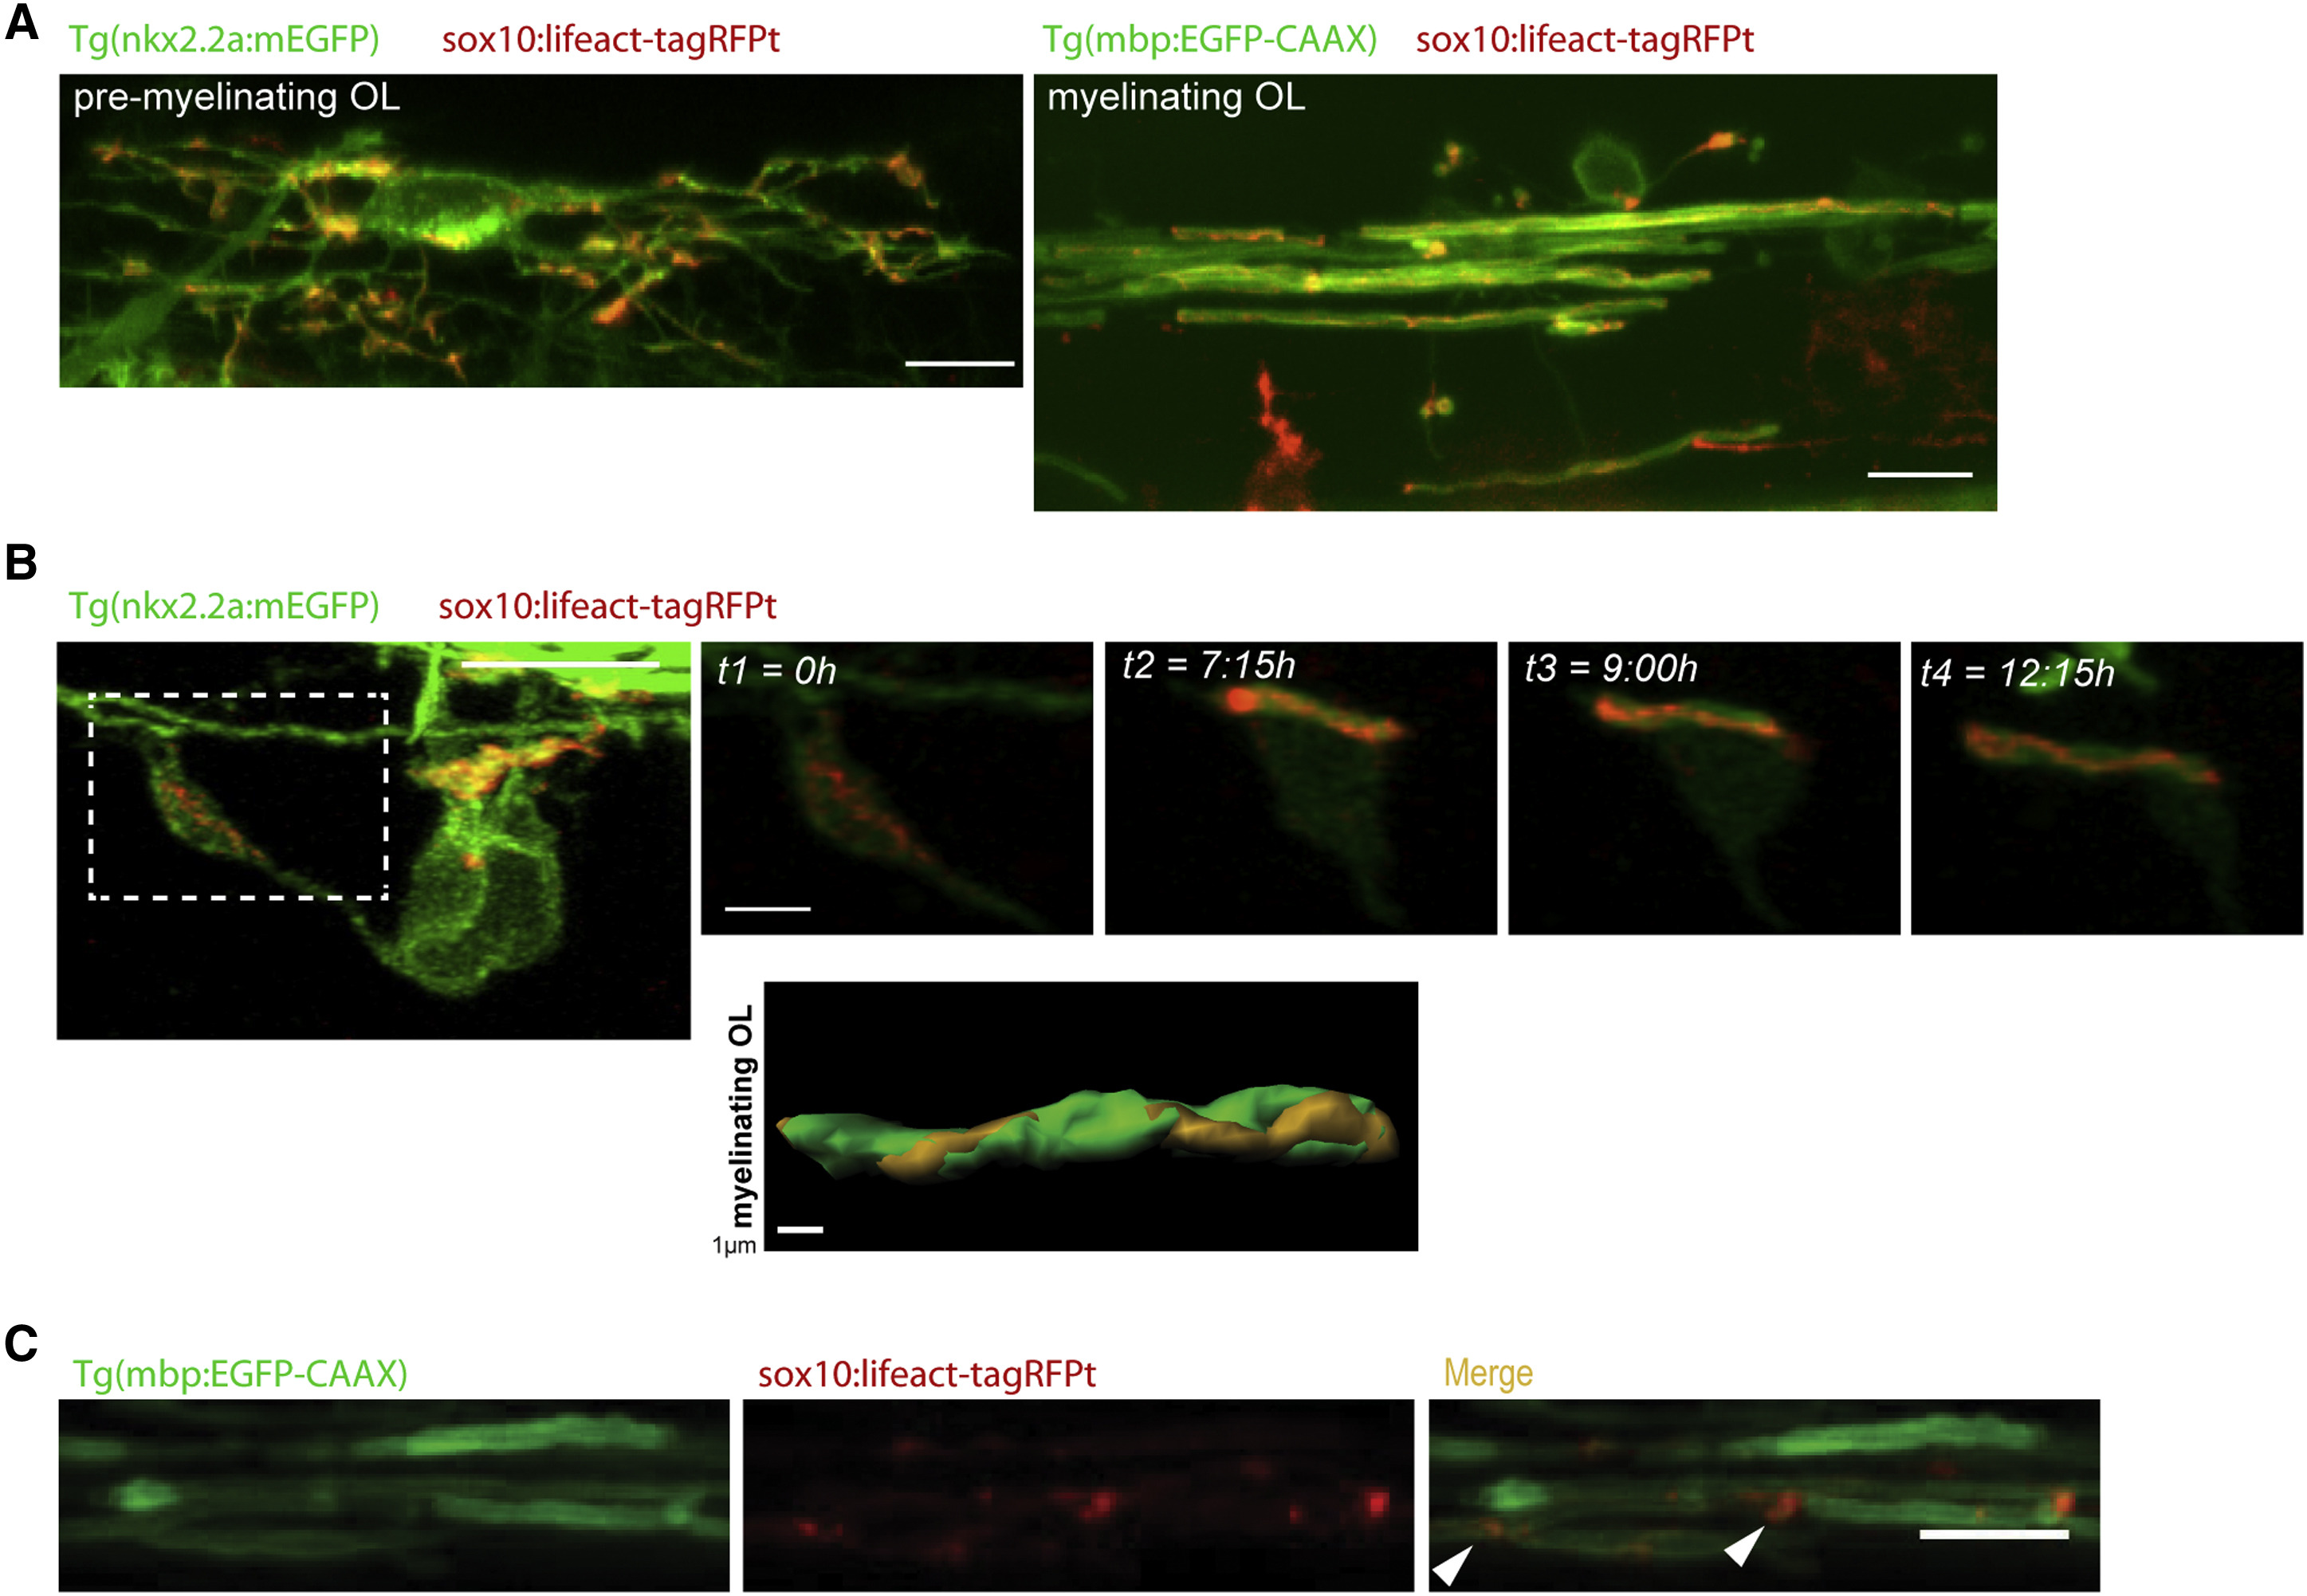
Localization and Dynamics of Filamentous Actin during Myelin Formation in Zebrafish
(A) Left, premyelinating oligodendrocyte visualized with membrane-targeted GFP using Tg(nkx2.2a:meGFP); right, myelinating oligodendrocyte visualized using Tg(mbp:EGFP-CAAX) zebrafish lines. The zebrafish were injected with a plasmid encoding for Lifeact, fused with the red fluorescent protein tag-RFPt under control of sox10 upstream regulatory sequences to localize F-actin. The scale bars represent 10 μm.
(B) Time-lapse imaging of Lifeact-RFP in Tg(nkx2.2a:meGFP) zebrafish at initial stages of myelination. The Lifeact-RFP moves in a spiral pattern longitudinally along the axon. The scale bars represent 10 μm (zoom in images, 3 μm).
(C) At later stages, using Tg(mbp:EGFP-CAAX) and Lifeact-RFP, F-actin is found at the lateral edges - presumably the paranodes—of the myelin sheaths (arrow heads). The scale bar represents 5 μm.
See also Movies S1 and S2.
Reprinted from Developmental Cell, 34, Nawaz, S., Sánchez, P., Schmitt, S., Snaidero, N., Mitkovski, M., Velte, C., Brückner, B.R., Alexopoulos, I., Czopka, T., Jung, S.Y., Rhee, J.S., Janshoff, A., Witke, W., Schaap, I.A., Lyons, D.A., Simons, M., Actin filament turnover drives leading edge growth during myelin sheath formation in the central nervous system, 139-51, Copyright (2015) with permission from Elsevier. Full text @ Dev. Cell